
SUNCOR ENERGY INC (NYSE:SU) was identified as a stock worth exploring by dividend investors by our stock screener. NYSE:SU scores well on profitability, solvency and liquidity. At the same time it seems to pay a decent dividend. We'll explore this a bit deeper below.
Assessing Dividend Metrics for NYSE:SU
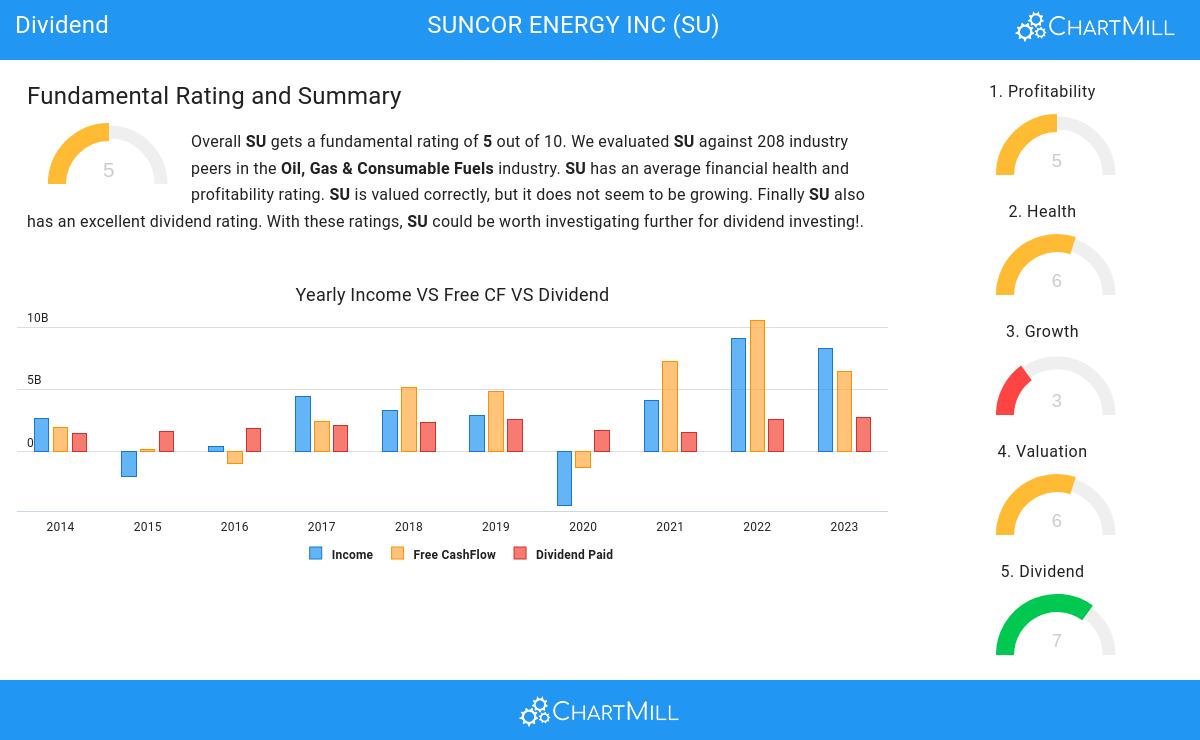
ChartMill employs its own Dividend Rating system for all stocks. This score, on a scale of 0 to 10, is determined by evaluating different dividend factors, such as yield, historical performance, dividend growth, and sustainability. NYSE:SU has been assigned a 7 for dividend:
- SU's Dividend Yield is a higher than the industry average which is at 6.03.
- Compared to an average S&P500 Dividend Yield of 2.24, SU pays a better dividend.
- The dividend of SU is nicely growing with an annual growth rate of 7.66%!
- SU has been paying a dividend for at least 10 years, so it has a reliable track record.
- 36.86% of the earnings are spent on dividend by SU. This is a low number and sustainable payout ratio.
- The dividend of SU is growing, but earnings are growing more, so the dividend growth is sustainable.
Exploring NYSE:SU's Health
Every stock is evaluated by ChartMill, receiving a Health Rating on a scale of 0 to 10. This assessment considers different health aspects, including liquidity and solvency, both in absolute terms and relative to industry peers. NYSE:SU has achieved a 6 out of 10:
- With a decent Altman-Z score value of 2.20, SU is doing good in the industry, outperforming 61.54% of the companies in the same industry.
- The Debt to FCF ratio of SU is 1.80, which is an excellent value as it means it would take SU, only 1.80 years of fcf income to pay off all of its debts.
- SU's Debt to FCF ratio of 1.80 is fine compared to the rest of the industry. SU outperforms 78.37% of its industry peers.
- A Debt/Equity ratio of 0.34 indicates that SU is not too dependend on debt financing.
- Looking at the Current ratio, with a value of 1.46, SU is in the better half of the industry, outperforming 60.10% of the companies in the same industry.
Analyzing Profitability Metrics
ChartMill assigns a proprietary Profitability Rating to each stock. The score is computed by evaluating various profitability ratios and margins and ranges from 0 to 10. NYSE:SU was assigned a score of 5 for profitability:
- SU has a better Return On Assets (8.34%) than 68.75% of its industry peers.
- SU has a Return On Equity of 16.95%. This is in the better half of the industry: SU outperforms 63.46% of its industry peers.
- In the last couple of years the Profit Margin of SU has grown nicely.
- With a decent Gross Margin value of 61.98%, SU is doing good in the industry, outperforming 68.27% of the companies in the same industry.
More Best Dividend stocks can be found in our Best Dividend screener.
Check the latest full fundamental report of SU for a complete fundamental analysis.
Disclaimer
This article should in no way be interpreted as advice. The article is based on the observed metrics at the time of writing, but you should always make your own analysis and trade or invest at your own responsibility.