
NYSE:ST is an undervalued gem with solid fundamentals.
By Mill Chart
Last update: Oct 17, 2024
Uncover the potential of SENSATA TECHNOLOGIES HOLDING (NYSE:ST) as our stock screener's choice for an undervalued stock. NYSE:ST maintains a strong financial position and offers an appealing valuation. We'll delve into the specifics below.
What does the Valuation looks like for NYSE:ST
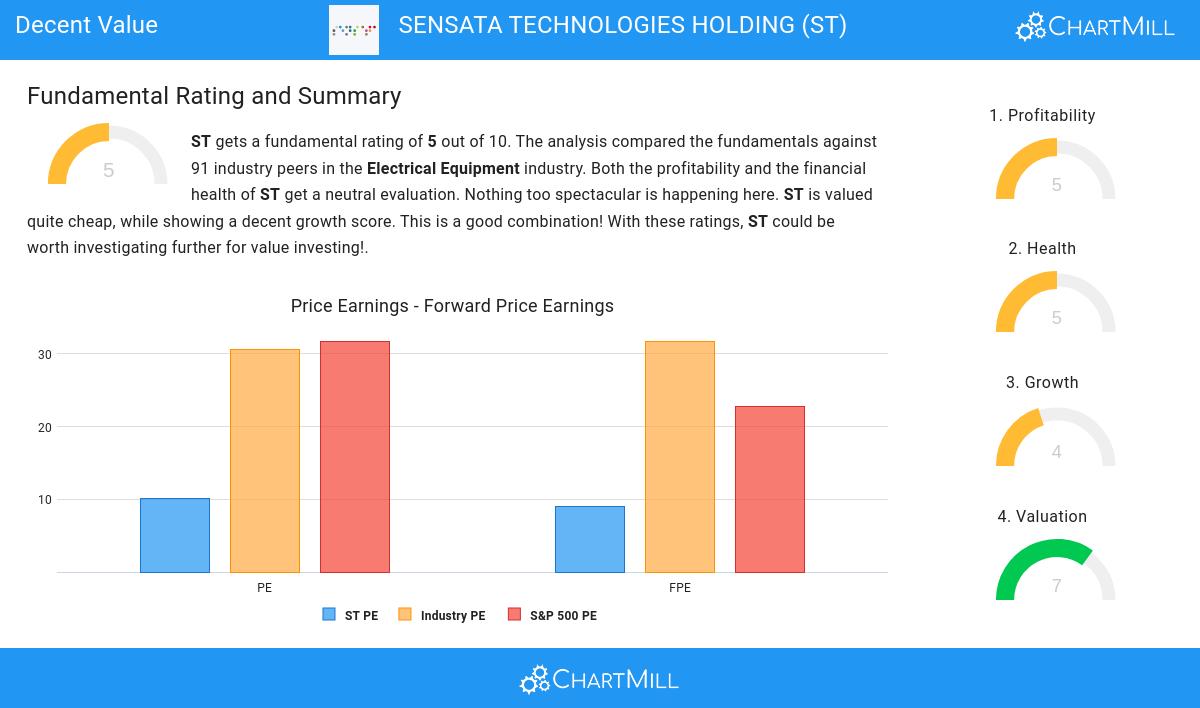
ChartMill assigns a Valuation Rating to every stock. This score ranges from 0 to 10 and evaluates the different valuation aspects and compares the price to earnings and cash flows, while taking into account profitability and growth. NYSE:ST scores a 7 out of 10:
- A Price/Earnings ratio of 10.14 indicates a reasonable valuation of ST.
- ST's Price/Earnings ratio is rather cheap when compared to the industry. ST is cheaper than 89.89% of the companies in the same industry.
- Compared to an average S&P500 Price/Earnings ratio of 31.76, ST is valued rather cheaply.
- A Price/Forward Earnings ratio of 8.98 indicates a reasonable valuation of ST.
- Based on the Price/Forward Earnings ratio, ST is valued cheaply inside the industry as 93.26% of the companies are valued more expensively.
- ST is valuated cheaply when we compare the Price/Forward Earnings ratio to 22.74, which is the current average of the S&P500 Index.
- ST's Enterprise Value to EBITDA ratio is rather cheap when compared to the industry. ST is cheaper than 86.52% of the companies in the same industry.
- Based on the Price/Free Cash Flow ratio, ST is valued cheaper than 85.39% of the companies in the same industry.
Understanding NYSE:ST's Profitability
ChartMill assigns a proprietary Profitability Rating to each stock. The score is computed by evaluating various profitability ratios and margins and ranges from 0 to 10. NYSE:ST was assigned a score of 5 for profitability:
- The Return On Assets of ST (0.10%) is better than 68.54% of its industry peers.
- With a decent Return On Equity value of 0.28%, ST is doing good in the industry, outperforming 68.54% of the companies in the same industry.
- ST's Return On Invested Capital of 6.43% is fine compared to the rest of the industry. ST outperforms 76.40% of its industry peers.
- ST's Profit Margin of 0.21% is fine compared to the rest of the industry. ST outperforms 68.54% of its industry peers.
- ST's Operating Margin of 13.45% is amongst the best of the industry. ST outperforms 84.27% of its industry peers.
- ST has a Gross Margin of 30.53%. This is in the better half of the industry: ST outperforms 73.03% of its industry peers.
Health Analysis for NYSE:ST
ChartMill employs its own Health Rating for stock assessment. This rating, ranging from 0 to 10, is calculated by examining various liquidity and solvency ratios. In the case of NYSE:ST, the assigned 5 reflects its health status:
- Looking at the Altman-Z score, with a value of 1.92, ST is in the better half of the industry, outperforming 64.04% of the companies in the same industry.
- With a decent Debt to FCF ratio value of 12.70, ST is doing good in the industry, outperforming 66.29% of the companies in the same industry.
Understanding NYSE:ST's Growth Score
ChartMill employs its own Growth Rating system for all stocks. This score, ranging from 0 to 10, is derived by evaluating different growth factors, such as EPS and revenue growth, taking into account both past performance and future projections. NYSE:ST has earned a 4 for growth:
- The Earnings Per Share is expected to grow by 9.07% on average over the next years. This is quite good.
- When comparing the EPS growth rate of the last years to the growth rate of the upcoming years, we see that the growth is accelerating.
- When comparing the Revenue growth rate of the last years to the growth rate of the upcoming years, we see that the growth is accelerating.
Our Decent Value screener lists more Decent Value stocks and is updated daily.
For an up to date full fundamental analysis you can check the fundamental report of ST
Disclaimer
This article should in no way be interpreted as advice. The article is based on the observed metrics at the time of writing, but you should always make your own analysis and trade or invest at your own responsibility.