
Don't overlook NYSE:ST—it's a hidden gem with strong fundamentals and an attractive price tag.
By Mill Chart
Last update: Sep 26, 2024
Our stock screening tool has pinpointed SENSATA TECHNOLOGIES HOLDING (NYSE:ST) as an undervalued stock option. NYSE:ST retains a strong financial foundation and an attractive price tag. Let's delve into the specifics below.
ChartMill's Evaluation of Valuation
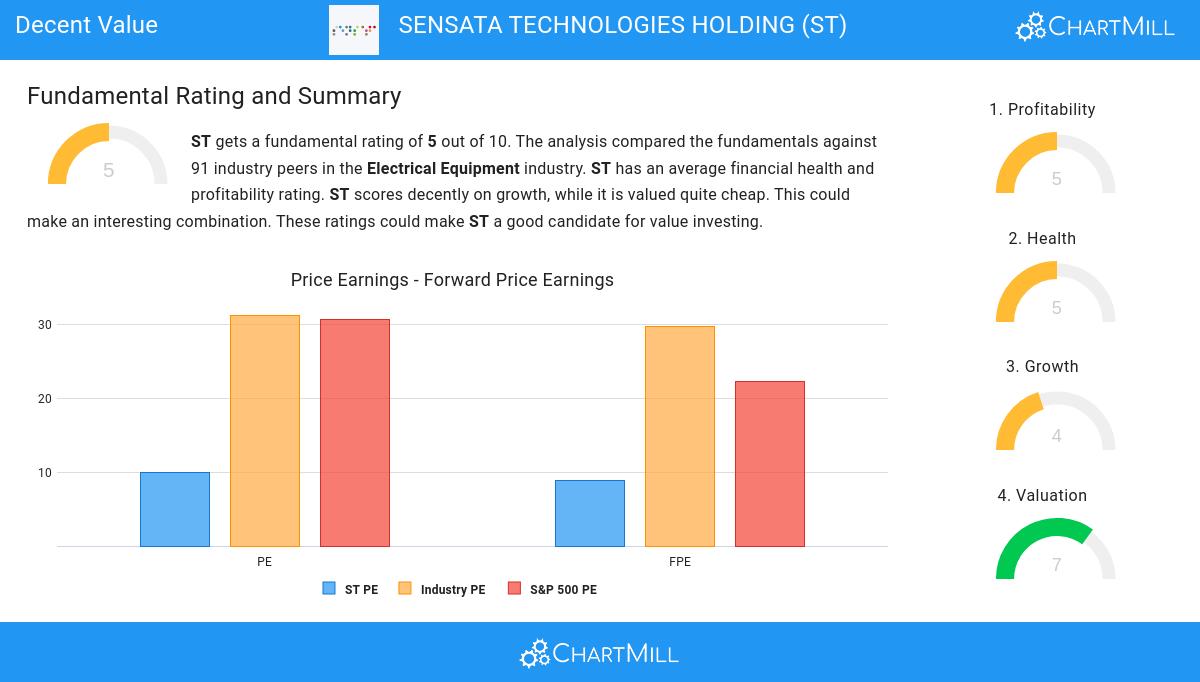
ChartMill assigns a proprietary Valuation Rating to each stock. The score is computed by evaluating various valuation aspects, like price to earnings and free cash flow, both absolutely as relative to the market and industry. NYSE:ST was assigned a score of 7 for valuation:
- A Price/Earnings ratio of 9.95 indicates a reasonable valuation of ST.
- Based on the Price/Earnings ratio, ST is valued cheaper than 89.89% of the companies in the same industry.
- When comparing the Price/Earnings ratio of ST to the average of the S&P500 Index (30.63), we can say ST is valued rather cheaply.
- Based on the Price/Forward Earnings ratio of 8.81, the valuation of ST can be described as reasonable.
- Based on the Price/Forward Earnings ratio, ST is valued cheaply inside the industry as 93.26% of the companies are valued more expensively.
- The average S&P500 Price/Forward Earnings ratio is at 22.19. ST is valued rather cheaply when compared to this.
- ST's Enterprise Value to EBITDA ratio is rather cheap when compared to the industry. ST is cheaper than 86.52% of the companies in the same industry.
- Compared to the rest of the industry, the Price/Free Cash Flow ratio of ST indicates a rather cheap valuation: ST is cheaper than 83.15% of the companies listed in the same industry.
Understanding NYSE:ST's Profitability
Discover ChartMill's exclusive Profitability Rating, a proprietary metric that assesses stocks on a scale of 0 to 10. It takes into consideration various profitability ratios and margins, both in absolute terms and relative to industry peers. Notably, NYSE:ST has achieved a 5:
- ST's Return On Assets of 0.10% is fine compared to the rest of the industry. ST outperforms 68.54% of its industry peers.
- Looking at the Return On Equity, with a value of 0.28%, ST is in the better half of the industry, outperforming 68.54% of the companies in the same industry.
- With a decent Return On Invested Capital value of 6.43%, ST is doing good in the industry, outperforming 76.40% of the companies in the same industry.
- The Profit Margin of ST (0.21%) is better than 68.54% of its industry peers.
- The Operating Margin of ST (13.45%) is better than 84.27% of its industry peers.
- Looking at the Gross Margin, with a value of 30.53%, ST is in the better half of the industry, outperforming 73.03% of the companies in the same industry.
Health Assessment of NYSE:ST
ChartMill employs its own Health Rating for stock assessment. This rating, ranging from 0 to 10, is calculated by examining various liquidity and solvency ratios. In the case of NYSE:ST, the assigned 5 reflects its health status:
- The Altman-Z score of ST (1.91) is better than 61.80% of its industry peers.
- ST has a better Debt to FCF ratio (12.70) than 66.29% of its industry peers.
Looking at the Growth
ChartMill assigns a Growth Rating to every stock. This score ranges from 0 to 10 and evaluates the different growth aspects like EPS and Revenue, both in the past as in the future. NYSE:ST scores a 4 out of 10:
- Based on estimates for the next years, ST will show a quite strong growth in Earnings Per Share. The EPS will grow by 9.07% on average per year.
- When comparing the EPS growth rate of the last years to the growth rate of the upcoming years, we see that the growth is accelerating.
- When comparing the Revenue growth rate of the last years to the growth rate of the upcoming years, we see that the growth is accelerating.
Every day, new Decent Value stocks can be found on ChartMill in our Decent Value screener.
Our latest full fundamental report of ST contains the most current fundamental analsysis.
Disclaimer
This article should in no way be interpreted as advice. The article is based on the observed metrics at the time of writing, but you should always make your own analysis and trade or invest at your own responsibility.
