Why the dividend investor may take a look at NYSE:SON.
By Mill Chart
Last update: Feb 6, 2025
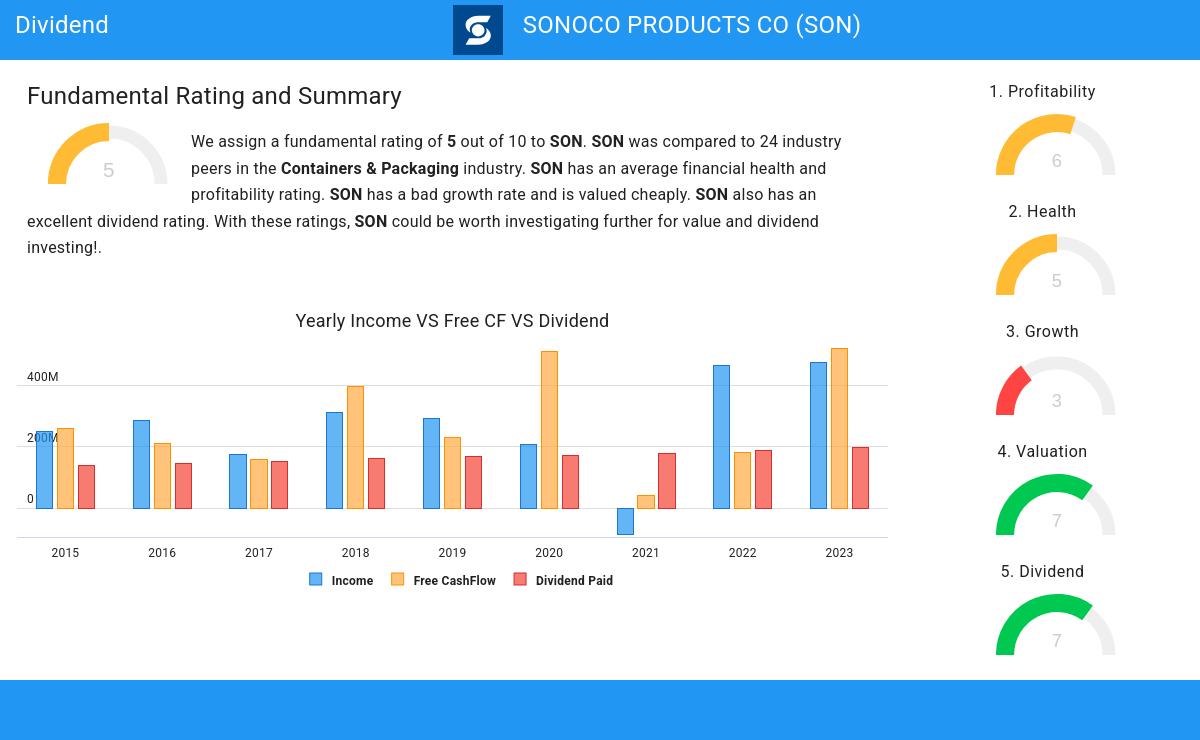
Our stock screener has spotted SONOCO PRODUCTS CO (NYSE:SON) as a good dividend stock with solid fundamentals. NYSE:SON shows decent health and profitability. At the same time it gives a good and sustainable dividend. We'll dive into each aspect below.
Dividend Assessment of NYSE:SON
An integral part of ChartMill's stock analysis is the Dividend Rating, which spans from 0 to 10. This rating evaluates diverse dividend factors, including yield, historical data, growth, and sustainability. NYSE:SON has received a 7 out of 10:
- With a Yearly Dividend Yield of 4.31%, SON is a good candidate for dividend investing.
- SON's Dividend Yield is rather good when compared to the industry average which is at 3.11. SON pays more dividend than 86.96% of the companies in the same industry.
- SON's Dividend Yield is rather good when compared to the S&P500 average which is at 2.28.
- SON has paid a dividend for at least 10 years, which is a reliable track record.
- SON has not decreased their dividend for at least 10 years, which is a reliable track record.
Understanding NYSE:SON's Health
ChartMill employs a unique Health Rating system for all stocks. This rating, ranging from 0 to 10, is determined by analyzing various liquidity and solvency ratios. For NYSE:SON, the assigned 5 for health provides valuable insights:
- SON's Altman-Z score of 2.12 is fine compared to the rest of the industry. SON outperforms 69.57% of its industry peers.
- SON has a Current Ratio of 2.36. This indicates that SON is financially healthy and has no problem in meeting its short term obligations.
- With an excellent Current ratio value of 2.36, SON belongs to the best of the industry, outperforming 91.30% of the companies in the same industry.
- The Quick ratio of SON (1.91) is better than 82.61% of its industry peers.
Exploring NYSE:SON's Profitability
ChartMill's Profitability Rating offers a unique perspective on stock analysis, providing scores from 0 to 10. These ratings consider a wide range of profitability metrics and margins, both in comparison to industry peers and on their own merits. For NYSE:SON, the assigned 6 is a significant indicator of profitability:
- Measured over the past 3 years, the Average Return On Invested Capital for SON is above the industry average of 7.55%.
- SON's Profit Margin has improved in the last couple of years.
- SON's Operating Margin of 9.93% is fine compared to the rest of the industry. SON outperforms 65.22% of its industry peers.
- In the last couple of years the Operating Margin of SON has grown nicely.
- In the last couple of years the Gross Margin of SON has grown nicely.
Every day, new Best Dividend stocks can be found on ChartMill in our Best Dividend screener.
Check the latest full fundamental report of SON for a complete fundamental analysis.
Disclaimer
This article should in no way be interpreted as advice. The article is based on the observed metrics at the time of writing, but you should always make your own analysis and trade or invest at your own responsibility.
SONOCO PRODUCTS CO
NYSE:SON (2/11/2025, 1:53:36 PM)
47.55
+0.19 (+0.4%)
SON Latest News and Analysis
 5 days ago - ChartmillWhy the dividend investor may take a look at NYSE:SON.
Balancing Dividends and Fundamentals: The Case of SONOCO PRODUCTS CO (NYSE:SON).
