
Discover SUPER MICRO COMPUTER INC (NASDAQ:SMCI), an undervalued stock highlighted by our stock screener. NASDAQ:SMCI showcases solid financial health and profitability while maintaining an appealing valuation. We'll explore the details.
Evaluating Valuation: NASDAQ:SMCI
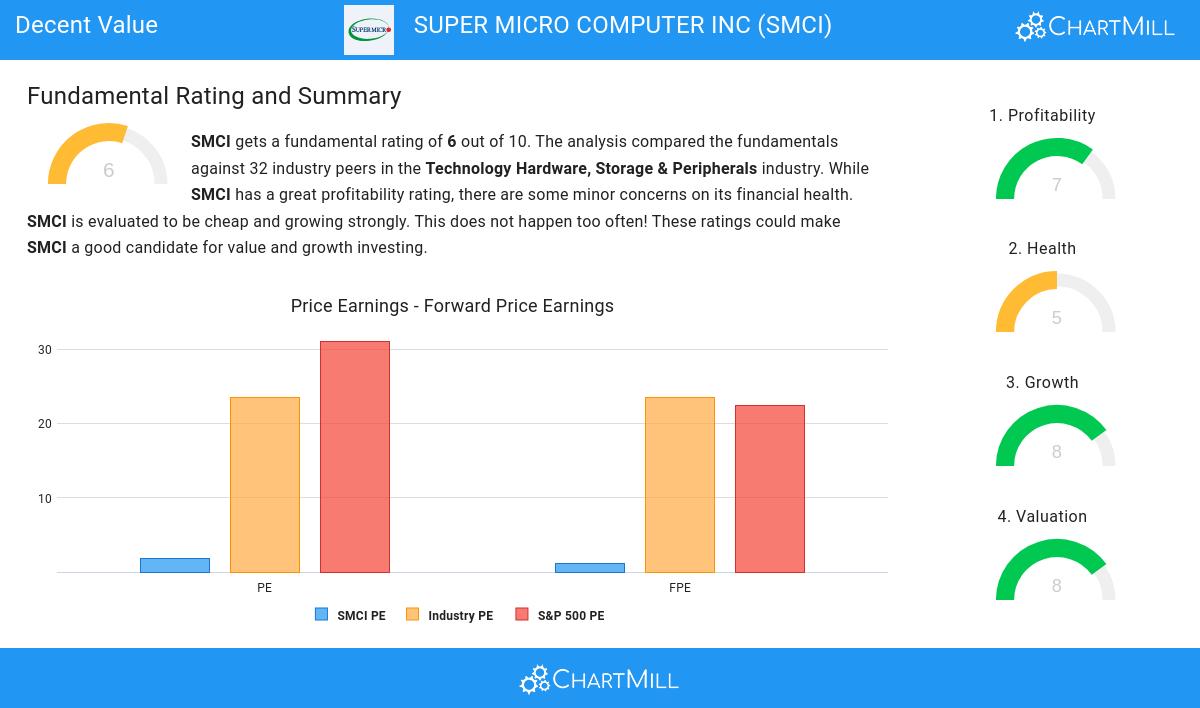
ChartMill assigns a Valuation Rating to every stock. This score ranges from 0 to 10 and evaluates the different valuation aspects and compares the price to earnings and cash flows, while taking into account profitability and growth. NASDAQ:SMCI scores a 8 out of 10:
- SMCI is valuated cheaply with a Price/Earnings ratio of 1.85.
- SMCI's Price/Earnings ratio is rather cheap when compared to the industry. SMCI is cheaper than 100.00% of the companies in the same industry.
- Compared to an average S&P500 Price/Earnings ratio of 31.08, SMCI is valued rather cheaply.
- With a Price/Forward Earnings ratio of 1.14, the valuation of SMCI can be described as very cheap.
- SMCI's Price/Forward Earnings ratio is rather cheap when compared to the industry. SMCI is cheaper than 100.00% of the companies in the same industry.
- SMCI's Price/Forward Earnings ratio indicates a rather cheap valuation when compared to the S&P500 average which is at 22.39.
- Based on the Enterprise Value to EBITDA ratio, SMCI is valued cheaper than 96.88% of the companies in the same industry.
- The low PEG Ratio(NY), which compensates the Price/Earnings for growth, indicates a rather cheap valuation of the company.
- SMCI has a very decent profitability rating, which may justify a higher PE ratio.
- A more expensive valuation may be justified as SMCI's earnings are expected to grow with 32.68% in the coming years.
A Closer Look at Profitability for NASDAQ:SMCI
Discover ChartMill's exclusive Profitability Rating, a proprietary metric that assesses stocks on a scale of 0 to 10. It takes into consideration various profitability ratios and margins, both in absolute terms and relative to industry peers. Notably, NASDAQ:SMCI has achieved a 7:
- SMCI's Return On Assets of 11.84% is amongst the best of the industry. SMCI outperforms 84.38% of its industry peers.
- SMCI's Return On Equity of 20.59% is amongst the best of the industry. SMCI outperforms 84.38% of its industry peers.
- Looking at the Return On Invested Capital, with a value of 14.50%, SMCI is in the better half of the industry, outperforming 78.13% of the companies in the same industry.
- The Average Return On Invested Capital over the past 3 years for SMCI is above the industry average of 16.99%.
- The 3 year average ROIC (20.84%) for SMCI is well above the current ROIC(14.50%). The reason for the recent decline needs to be investigated.
- Looking at the Profit Margin, with a value of 8.88%, SMCI belongs to the top of the industry, outperforming 84.38% of the companies in the same industry.
- SMCI's Profit Margin has improved in the last couple of years.
- The Operating Margin of SMCI (9.72%) is better than 81.25% of its industry peers.
- SMCI's Operating Margin has improved in the last couple of years.
Assessing Health Metrics for NASDAQ:SMCI
ChartMill employs its own Health Rating for stock assessment. This rating, ranging from 0 to 10, is calculated by examining various liquidity and solvency ratios. In the case of NASDAQ:SMCI, the assigned 5 reflects its health status:
- SMCI has an Altman-Z score of 3.36. This indicates that SMCI is financially healthy and has little risk of bankruptcy at the moment.
- SMCI has a better Altman-Z score (3.36) than 75.00% of its industry peers.
- SMCI has a Debt/Equity ratio of 0.35. This is a healthy value indicating a solid balance between debt and equity.
- A Current Ratio of 4.69 indicates that SMCI has no problem at all paying its short term obligations.
- Looking at the Current ratio, with a value of 4.69, SMCI belongs to the top of the industry, outperforming 84.38% of the companies in the same industry.
- A Quick Ratio of 2.29 indicates that SMCI has no problem at all paying its short term obligations.
- The Quick ratio of SMCI (2.29) is better than 75.00% of its industry peers.
Growth Analysis for NASDAQ:SMCI
To evaluate a stock's growth potential, ChartMill utilizes a Growth Rating on a scale of 0 to 10. This comprehensive assessment considers various growth aspects, including historical and estimated EPS and revenue growth. NASDAQ:SMCI has achieved a 8 out of 10:
- The Earnings Per Share has grown by an impressive 85.45% over the past year.
- SMCI shows a strong growth in Earnings Per Share. Measured over the last years, the EPS has been growing by 66.56% yearly.
- Looking at the last year, SMCI shows a very strong growth in Revenue. The Revenue has grown by 109.77%.
- The Revenue has been growing by 33.68% on average over the past years. This is a very strong growth!
- Based on estimates for the next years, SMCI will show a very strong growth in Earnings Per Share. The EPS will grow by 32.68% on average per year.
- Based on estimates for the next years, SMCI will show a quite strong growth in Revenue. The Revenue will grow by 9.60% on average per year.
More Decent Value stocks can be found in our Decent Value screener.
For an up to date full fundamental analysis you can check the fundamental report of SMCI
Keep in mind
Important Note: The content of this article is not intended as trading advice. It is essential to perform your own analysis and exercise caution when making trading decisions. The article presents observations created by automated analysis but does not guarantee any trading or investment outcomes. Always trade responsibly and make independent judgments.


