
In the world of growth stocks, NASDAQ:SMCI shines as a value proposition.
By Mill Chart
Last update: Sep 26, 2024
Our stock screener has singled out SUPER MICRO COMPUTER INC (NASDAQ:SMCI) as an attractive growth opportunity. NASDAQ:SMCI is demonstrating remarkable growth potential while maintaining strong financial indicators, making it a reasonably priced option. We'll explore this further.
Assessing Growth Metrics for NASDAQ:SMCI
ChartMill assigns a Growth Rating to every stock. This score ranges from 0 to 10 and evaluates the different growth aspects like EPS and Revenue, both in the past as in the future. NASDAQ:SMCI scores a 8 out of 10:
- SMCI shows a strong growth in Earnings Per Share. In the last year, the EPS has been growing by 85.45%, which is quite impressive.
- SMCI shows a strong growth in Earnings Per Share. Measured over the last years, the EPS has been growing by 66.56% yearly.
- The Revenue has grown by 109.77% in the past year. This is a very strong growth!
- The Revenue has been growing by 33.68% on average over the past years. This is a very strong growth!
- The Earnings Per Share is expected to grow by 32.68% on average over the next years. This is a very strong growth
- SMCI is expected to show quite a strong growth in Revenue. In the coming years, the Revenue will grow by 9.60% yearly.
How We Gauge Valuation for NASDAQ:SMCI
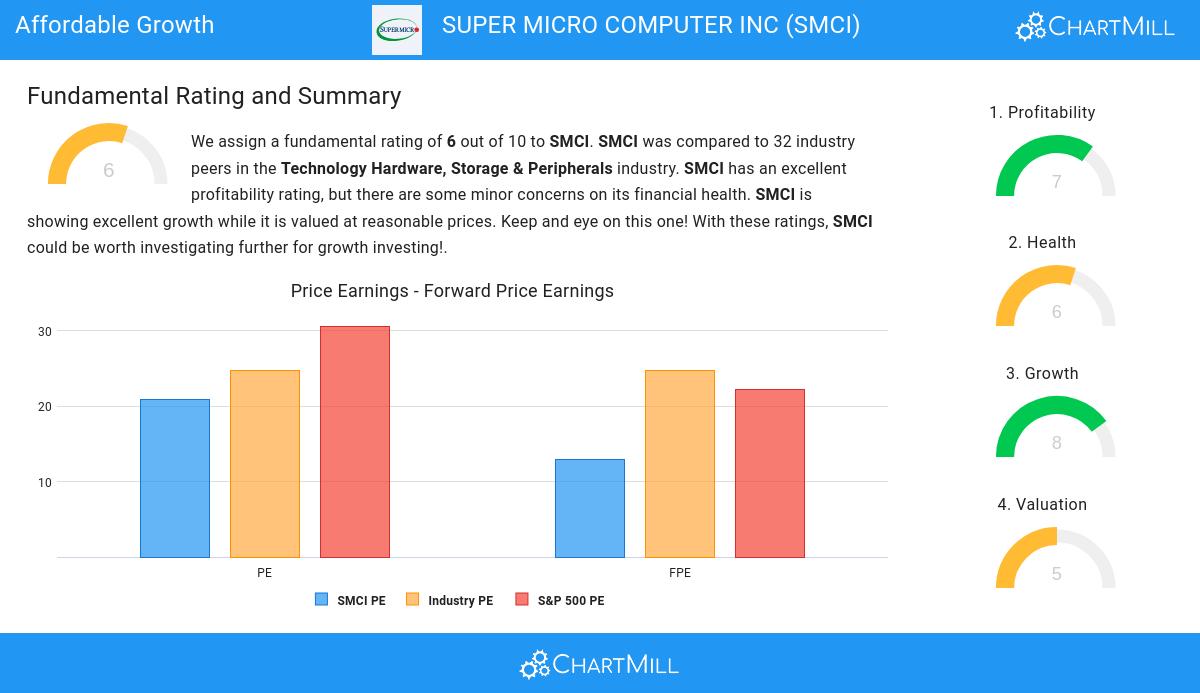
ChartMill employs its own Valuation Rating system for all stocks. This score, ranging from 0 to 10, is determined by evaluating different valuation factors, including price to earnings and free cash flow, both in absolute terms and relative to the market and industry. NASDAQ:SMCI has earned a 5 for valuation:
- The average S&P500 Price/Earnings ratio is at 30.63. SMCI is valued slightly cheaper when compared to this.
- SMCI's Price/Forward Earnings ratio is a bit cheaper when compared to the industry. SMCI is cheaper than 65.63% of the companies in the same industry.
- SMCI is valuated rather cheaply when we compare the Price/Forward Earnings ratio to 22.19, which is the current average of the S&P500 Index.
- Based on the Enterprise Value to EBITDA ratio, SMCI is valued a bit cheaper than 62.50% of the companies in the same industry.
- The low PEG Ratio(NY), which compensates the Price/Earnings for growth, indicates a rather cheap valuation of the company.
- The decent profitability rating of SMCI may justify a higher PE ratio.
- SMCI's earnings are expected to grow with 32.68% in the coming years. This may justify a more expensive valuation.
Health Analysis for NASDAQ:SMCI
ChartMill employs its own Health Rating for stock assessment. This rating, ranging from 0 to 10, is calculated by examining various liquidity and solvency ratios. In the case of NASDAQ:SMCI, the assigned 6 reflects its health status:
- An Altman-Z score of 7.25 indicates that SMCI is not in any danger for bankruptcy at the moment.
- SMCI has a better Altman-Z score (7.25) than 87.50% of its industry peers.
- A Debt/Equity ratio of 0.35 indicates that SMCI is not too dependend on debt financing.
- SMCI has a Current Ratio of 4.69. This indicates that SMCI is financially healthy and has no problem in meeting its short term obligations.
- The Current ratio of SMCI (4.69) is better than 84.38% of its industry peers.
- A Quick Ratio of 2.29 indicates that SMCI has no problem at all paying its short term obligations.
- SMCI has a better Quick ratio (2.29) than 75.00% of its industry peers.
A Closer Look at Profitability for NASDAQ:SMCI
ChartMill's Profitability Rating offers a unique perspective on stock analysis, providing scores from 0 to 10. These ratings consider a wide range of profitability metrics and margins, both in comparison to industry peers and on their own merits. For NASDAQ:SMCI, the assigned 7 is a significant indicator of profitability:
- Looking at the Return On Assets, with a value of 11.84%, SMCI belongs to the top of the industry, outperforming 84.38% of the companies in the same industry.
- SMCI has a Return On Equity of 20.59%. This is amongst the best in the industry. SMCI outperforms 84.38% of its industry peers.
- With a decent Return On Invested Capital value of 14.50%, SMCI is doing good in the industry, outperforming 78.13% of the companies in the same industry.
- The Average Return On Invested Capital over the past 3 years for SMCI is above the industry average of 16.99%.
- The last Return On Invested Capital (14.50%) for SMCI is well below the 3 year average (20.84%), which needs to be investigated, but indicates that SMCI had better years and this may not be a problem.
- SMCI's Profit Margin of 8.88% is amongst the best of the industry. SMCI outperforms 84.38% of its industry peers.
- SMCI's Profit Margin has improved in the last couple of years.
- SMCI's Operating Margin of 9.72% is amongst the best of the industry. SMCI outperforms 81.25% of its industry peers.
- In the last couple of years the Operating Margin of SMCI has grown nicely.
Our Affordable Growth screener lists more Affordable Growth stocks and is updated daily.
Our latest full fundamental report of SMCI contains the most current fundamental analsysis.
Disclaimer
This article should in no way be interpreted as advice. The article is based on the observed metrics at the time of writing, but you should always make your own analysis and trade or invest at your own responsibility.
36.47
+0.66 (+1.84%)
Find more stocks in the Stock Screener
SMCI Latest News and Analysis
 13 hours ago - ChartmillExplore the S&P500 index on Friday and find out which stocks are the most active in today's session.
Curious about the most active S&P500 stocks in today's session? Get insights into the stocks that are leading the way in terms of trading volume and market attention.
 2 days ago - ChartmillExploring the top movers within the S&P500 index during today's session.
Let's have a look at the top S&P500 gainers and losers one hour before the close of the markets of today's session.
2 days ago - ChartmillMost active S&P500 stocks in Thursday's sessionLooking for the most active S&P500 stocks in today's session? Join us as we dive into the US markets on Thursday and discover the stocks that are dominating the trading activity and setting the pace for the market.
3 days ago - ChartmillStay informed with the top movers within the S&P500 index on Wednesday.Get insights into the S&P500 index performance on Wednesday. Explore the top gainers and losers within the S&P500 index in today's session.
3 days ago - ChartmillLooking for the most active stocks in the S&P500 index on Wednesday?Explore the S&P500 index on Wednesday and find out which stocks are the most active in today's session. Stay updated with the stocks that are capturing market interest.
3 days ago - ChartmillExplore the top gainers and losers within the S&P500 index in today's session.Wondering what's happening in today's session for the S&P500 index? Stay informed with the top movers within the S&P500 index on Wednesday.
 3 days ago - ChartmillWhich S&P500 stocks are gapping on Wednesday?
Curious about the S&P500 stocks that are gapping on Wednesday? Explore the gap up and gap down stocks in the S&P500 index during today's session.
 3 days ago - ChartmillWhat's going on in today's pre-market session: S&P500 movers
Stay updated with the S&P500 stocks that are on the move in today's pre-market session.
5 days ago - ChartmillThese S&P500 stocks are moving in today's sessionLet's have a look at what is happening on the US markets one hour before the close of the markets on Monday. Below you can find the top S&P500 gainers and losers in today's session.
5 days ago - ChartmillWhich S&P500 stocks are the most active on Monday?Stay informed about the most active stocks in the S&P500 index on Monday's session. Discover the stocks that are generating the highest trading volume and driving market activity.
5 days ago - ChartmillDiscover which S&P500 stocks are making waves on Monday.Curious about the S&P500 stocks that are in motion on Monday? Join us as we explore the top movers within the S&P500 index during today's session.
5 days ago - ChartmillGapping S&P500 stocks in Monday's sessionMonday's session is showcasing interesting market movements in the S&P500 index, with notable gap up and gap down stocks. Stay updated with the gapping S&P500 stocks in today's session.
