
Groth investors are looking for stocks showing high revenue and EPS growth. We will have a look here to see if SUPER MICRO COMPUTER INC (NASDAQ:SMCI) is suited for growth investing, while it is forming a base and may be ready to breakout. Investors should of course do their own research, but we spotted SUPER MICRO COMPUTER INC showing up in our growth with base formation screen, so it may be worth spending some more time on it.
Growth Assessment of NASDAQ:SMCI
ChartMill employs its own Growth Rating system for all stocks. This score, ranging from 0 to 10, is derived by evaluating different growth factors, such as EPS and revenue growth, taking into account both past performance and future projections. NASDAQ:SMCI has earned a 8 for growth:
- The Earnings Per Share has grown by an impressive 85.45% over the past year.
- SMCI shows a strong growth in Earnings Per Share. Measured over the last years, the EPS has been growing by 66.56% yearly.
- SMCI shows a strong growth in Revenue. In the last year, the Revenue has grown by 109.77%.
- SMCI shows a strong growth in Revenue. Measured over the last years, the Revenue has been growing by 33.68% yearly.
- The Earnings Per Share is expected to grow by 32.68% on average over the next years. This is a very strong growth
- Based on estimates for the next years, SMCI will show a quite strong growth in Revenue. The Revenue will grow by 9.60% on average per year.
ChartMill's Evaluation of Health
ChartMill utilizes a Health Rating to assess stocks, scoring them on a scale of 0 to 10. This rating takes into account a variety of liquidity and solvency ratios, both in absolute terms and in comparison to industry peers. NASDAQ:SMCI has earned a 6 out of 10:
- An Altman-Z score of 7.30 indicates that SMCI is not in any danger for bankruptcy at the moment.
- SMCI has a better Altman-Z score (7.30) than 90.63% of its industry peers.
- A Debt/Equity ratio of 0.35 indicates that SMCI is not too dependend on debt financing.
- SMCI has a Current Ratio of 4.69. This indicates that SMCI is financially healthy and has no problem in meeting its short term obligations.
- Looking at the Current ratio, with a value of 4.69, SMCI belongs to the top of the industry, outperforming 84.38% of the companies in the same industry.
- SMCI has a Quick Ratio of 2.29. This indicates that SMCI is financially healthy and has no problem in meeting its short term obligations.
- Looking at the Quick ratio, with a value of 2.29, SMCI is in the better half of the industry, outperforming 75.00% of the companies in the same industry.
Profitability Insights: NASDAQ:SMCI
ChartMill employs its own Profitability Rating system for stock evaluation. This score, ranging from 0 to 10, is derived from an analysis of diverse profitability metrics and margins. In the case of NASDAQ:SMCI, the assigned 7 is noteworthy for profitability:
- SMCI has a Return On Assets of 11.84%. This is amongst the best in the industry. SMCI outperforms 84.38% of its industry peers.
- With an excellent Return On Equity value of 20.59%, SMCI belongs to the best of the industry, outperforming 84.38% of the companies in the same industry.
- SMCI has a better Return On Invested Capital (14.50%) than 78.13% of its industry peers.
- SMCI had an Average Return On Invested Capital over the past 3 years of 20.84%. This is above the industry average of 16.99%.
- The 3 year average ROIC (20.84%) for SMCI is well above the current ROIC(14.50%). The reason for the recent decline needs to be investigated.
- Looking at the Profit Margin, with a value of 8.88%, SMCI belongs to the top of the industry, outperforming 84.38% of the companies in the same industry.
- In the last couple of years the Profit Margin of SMCI has grown nicely.
- With an excellent Operating Margin value of 9.72%, SMCI belongs to the best of the industry, outperforming 81.25% of the companies in the same industry.
- In the last couple of years the Operating Margin of SMCI has grown nicely.
Looking at the Setup
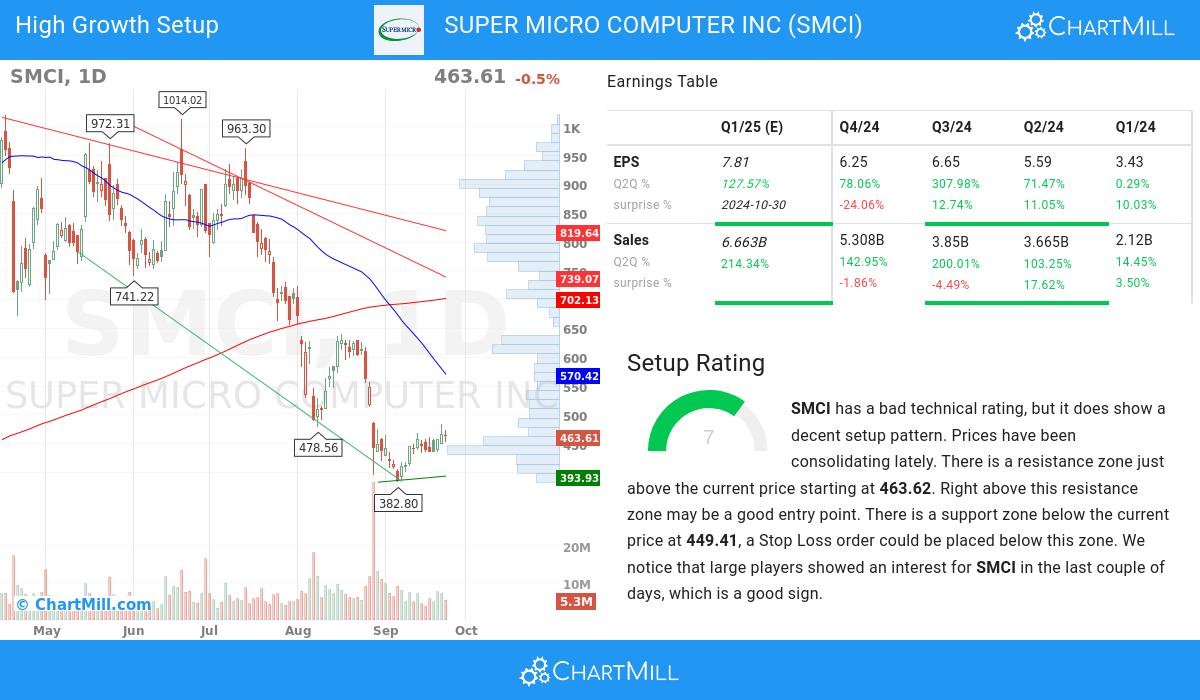
ChartMill incorporates a Setup Rating in its analysis, which measures the extent of consolidation in a stock over recent days and weeks. This rating, ranging from 0 to 10, is updated daily and takes into account multiple short-term technical indicators. The current setup rating for NASDAQ:SMCI is 7:
Although the technical rating is bad, SMCI does present a nice setup opportunity. Prices have been consolidating lately. There is a resistance zone just above the current price starting at 463.62. Right above this resistance zone may be a good entry point. There is a support zone below the current price at 449.41, a Stop Loss order could be placed below this zone. We notice that large players showed an interest for SMCI in the last couple of days, which is a good sign.
Our Strong Growth screener lists more Strong Growth stocks and is updated daily.
For an up to date full fundamental analysis you can check the fundamental report of SMCI
Our latest full technical report of SMCI contains the most current technical analsysis.
Disclaimer
This is not investing advice! The article highlights some of the observations at the time of writing, but you should always make your own analysis and invest based on your own insights.


