NYSE:SM stands out as a stock that provides good value for the fundamentals it showcases.
By Mill Chart
Last update: Feb 19, 2025
Consider SM ENERGY CO (NYSE:SM) as a top value stock, identified by our stock screening tool. NYSE:SM shines in terms of profitability, solvency, and liquidity, all while remaining very reasonably priced. Let's dive deeper into the analysis.
Unpacking NYSE:SM's Valuation Rating
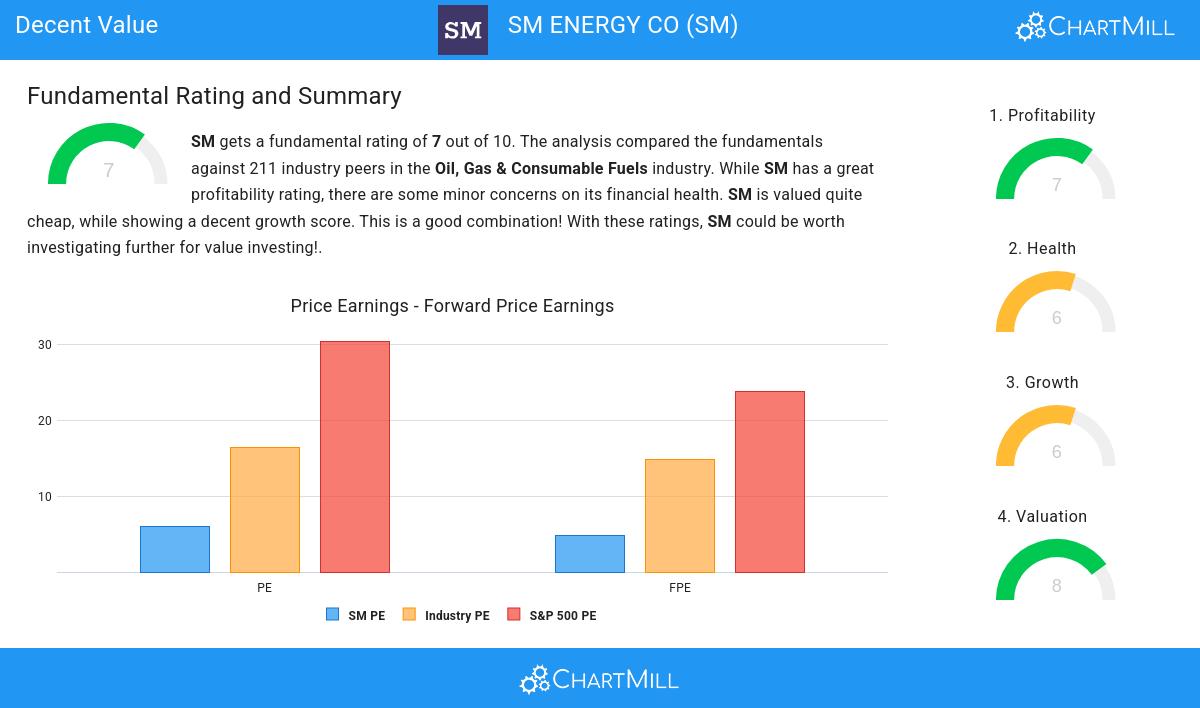
ChartMill assigns a proprietary Valuation Rating to each stock. The score is computed by evaluating various valuation aspects, like price to earnings and free cash flow, both absolutely as relative to the market and industry. NYSE:SM was assigned a score of 8 for valuation:
- SM is valuated cheaply with a Price/Earnings ratio of 5.97.
- Based on the Price/Earnings ratio, SM is valued cheaply inside the industry as 83.82% of the companies are valued more expensively.
- SM is valuated cheaply when we compare the Price/Earnings ratio to 30.43, which is the current average of the S&P500 Index.
- With a Price/Forward Earnings ratio of 4.82, the valuation of SM can be described as very cheap.
- Based on the Price/Forward Earnings ratio, SM is valued cheaper than 91.67% of the companies in the same industry.
- Compared to an average S&P500 Price/Forward Earnings ratio of 23.78, SM is valued rather cheaply.
- Based on the Enterprise Value to EBITDA ratio, SM is valued cheaply inside the industry as 83.82% of the companies are valued more expensively.
- Based on the Price/Free Cash Flow ratio, SM is valued a bit cheaper than the industry average as 73.04% of the companies are valued more expensively.
- SM's low PEG Ratio(NY), which compensates the Price/Earnings for growth, indicates a rather cheap valuation of the company.
- The decent profitability rating of SM may justify a higher PE ratio.
Evaluating Profitability: NYSE:SM
ChartMill assigns a proprietary Profitability Rating to each stock. The score is computed by evaluating various profitability ratios and margins and ranges from 0 to 10. NYSE:SM was assigned a score of 7 for profitability:
- With a decent Return On Assets value of 10.33%, SM is doing good in the industry, outperforming 76.96% of the companies in the same industry.
- With a decent Return On Equity value of 20.41%, SM is doing good in the industry, outperforming 75.00% of the companies in the same industry.
- With a decent Return On Invested Capital value of 10.76%, SM is doing good in the industry, outperforming 71.08% of the companies in the same industry.
- The last Return On Invested Capital (10.76%) for SM is well below the 3 year average (22.74%), which needs to be investigated, but indicates that SM had better years and this may not be a problem.
- SM's Profit Margin of 33.89% is amongst the best of the industry. SM outperforms 84.31% of its industry peers.
- SM's Profit Margin has improved in the last couple of years.
- SM has a better Operating Margin (38.74%) than 77.94% of its industry peers.
- SM's Operating Margin has improved in the last couple of years.
- Looking at the Gross Margin, with a value of 77.12%, SM belongs to the top of the industry, outperforming 86.76% of the companies in the same industry.
- SM's Gross Margin has improved in the last couple of years.
Unpacking NYSE:SM's Health Rating
ChartMill assigns a proprietary Health Rating to each stock. The score is computed by evaluating various liquidity and solvency ratios and ranges from 0 to 10. NYSE:SM was assigned a score of 6 for health:
- The Altman-Z score of SM (2.03) is better than 60.29% of its industry peers.
- A Current Ratio of 3.52 indicates that SM has no problem at all paying its short term obligations.
- SM has a better Current ratio (3.52) than 82.84% of its industry peers.
- SM has a Quick Ratio of 3.52. This indicates that SM is financially healthy and has no problem in meeting its short term obligations.
- The Quick ratio of SM (3.52) is better than 84.31% of its industry peers.
Evaluating Growth: NYSE:SM
To evaluate a stock's growth potential, ChartMill utilizes a Growth Rating on a scale of 0 to 10. This comprehensive assessment considers various growth aspects, including historical and estimated EPS and revenue growth. NYSE:SM has achieved a 6 out of 10:
- The Earnings Per Share has grown by an nice 14.92% over the past year.
- SM shows a strong growth in Earnings Per Share. Measured over the last years, the EPS has been growing by 187.86% yearly.
- The Earnings Per Share is expected to grow by 9.18% on average over the next years. This is quite good.
- The Revenue is expected to grow by 12.88% on average over the next years. This is quite good.
- The Revenue growth rate is accelerating: in the next years the growth will be better than in the last years.
More Decent Value stocks can be found in our Decent Value screener.
Check the latest full fundamental report of SM for a complete fundamental analysis.
Disclaimer
Important Note: The content of this article is not intended as trading advice. It is essential to perform your own analysis and exercise caution when making trading decisions. The article presents observations created by automated analysis but does not guarantee any trading or investment outcomes. Always trade responsibly and make independent judgments.
38.83
+0.21 (+0.54%)
Find more stocks in the Stock Screener
SM Latest News and Analysis
 a day ago - ChartmillNYSE:SM stands out as a stock that provides good value for the fundamentals it showcases.
SM ENERGY CO has caught the attention as a great value stock. NYSE:SM excels in profitability, solvency, and liquidity, all while being very reasonably priced.
