Don't overlook NYSE:SM—it's a hidden gem with strong fundamentals and an attractive price tag.
By Mill Chart
Last update: Oct 11, 2024
Take a closer look at SM ENERGY CO (NYSE:SM), a remarkable value stock uncovered by our stock screener. NYSE:SM excels in fundamentals and maintains a very reasonable valuation. Let's break it down further.
Valuation Analysis for NYSE:SM
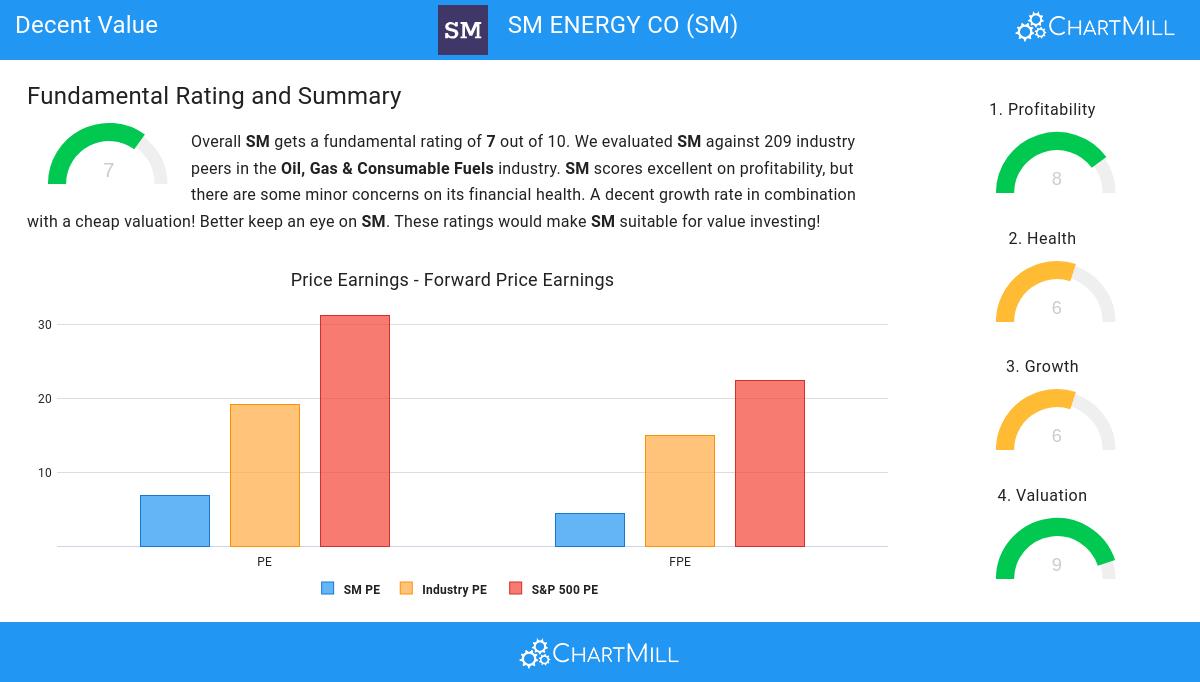
To assess a stock's valuation, ChartMill utilizes a Valuation Rating on a scale of 0 to 10. This comprehensive assessment considers various valuation aspects, comparing price to earnings and cash flows, while factoring in profitability and growth. NYSE:SM has achieved a 9 out of 10:
- The Price/Earnings ratio is 6.82, which indicates a rather cheap valuation of SM.
- Based on the Price/Earnings ratio, SM is valued cheaper than 80.38% of the companies in the same industry.
- Compared to an average S&P500 Price/Earnings ratio of 31.21, SM is valued rather cheaply.
- The Price/Forward Earnings ratio is 4.34, which indicates a rather cheap valuation of SM.
- Based on the Price/Forward Earnings ratio, SM is valued cheaper than 93.78% of the companies in the same industry.
- Compared to an average S&P500 Price/Forward Earnings ratio of 22.33, SM is valued rather cheaply.
- 81.82% of the companies in the same industry are more expensive than SM, based on the Enterprise Value to EBITDA ratio.
- Based on the Price/Free Cash Flow ratio, SM is valued a bit cheaper than the industry average as 64.11% of the companies are valued more expensively.
- SM's low PEG Ratio(NY), which compensates the Price/Earnings for growth, indicates a rather cheap valuation of the company.
- SM has an outstanding profitability rating, which may justify a higher PE ratio.
- SM's earnings are expected to grow with 19.88% in the coming years. This may justify a more expensive valuation.
How do we evaluate the Profitability for NYSE:SM?
ChartMill's Profitability Rating offers a unique perspective on stock analysis, providing scores from 0 to 10. These ratings consider a wide range of profitability metrics and margins, both in comparison to industry peers and on their own merits. For NYSE:SM, the assigned 8 is a significant indicator of profitability:
- With an excellent Return On Assets value of 12.18%, SM belongs to the best of the industry, outperforming 80.38% of the companies in the same industry.
- Looking at the Return On Equity, with a value of 21.10%, SM is in the better half of the industry, outperforming 72.25% of the companies in the same industry.
- The Return On Invested Capital of SM (13.61%) is better than 76.56% of its industry peers.
- The last Return On Invested Capital (13.61%) for SM is well below the 3 year average (22.74%), which needs to be investigated, but indicates that SM had better years and this may not be a problem.
- With an excellent Profit Margin value of 33.18%, SM belongs to the best of the industry, outperforming 81.34% of the companies in the same industry.
- SM's Profit Margin has improved in the last couple of years.
- SM's Operating Margin of 39.86% is fine compared to the rest of the industry. SM outperforms 77.51% of its industry peers.
- In the last couple of years the Operating Margin of SM has grown nicely.
- SM's Gross Margin of 77.51% is amongst the best of the industry. SM outperforms 87.56% of its industry peers.
- In the last couple of years the Gross Margin of SM has grown nicely.
Health Analysis for NYSE:SM
A critical element of ChartMill's stock evaluation is the Health Rating, which spans from 0 to 10. This rating considers multiple health factors, including liquidity and solvency, both in absolute terms and relative to industry peers. NYSE:SM has received a 6 out of 10:
- With a decent Altman-Z score value of 2.47, SM is doing good in the industry, outperforming 66.51% of the companies in the same industry.
- SM has a debt to FCF ratio of 3.18. This is a good value and a sign of high solvency as SM would need 3.18 years to pay back of all of its debts.
- SM's Debt to FCF ratio of 3.18 is fine compared to the rest of the industry. SM outperforms 68.90% of its industry peers.
- A Debt/Equity ratio of 0.41 indicates that SM is not too dependend on debt financing.
- SM has a Quick ratio of 1.29. This is in the better half of the industry: SM outperforms 63.64% of its industry peers.
Exploring NYSE:SM's Growth
ChartMill employs its own Growth Rating system for all stocks. This score, ranging from 0 to 10, is derived by evaluating different growth factors, such as EPS and revenue growth, taking into account both past performance and future projections. NYSE:SM has earned a 6 for growth:
- SM shows a strong growth in Earnings Per Share. In the last year, the EPS has been growing by 15.03%, which is quite good.
- Measured over the past years, SM shows a very strong growth in Earnings Per Share. The EPS has been growing by 187.86% on average per year.
- SM is expected to show quite a strong growth in Earnings Per Share. In the coming years, the EPS will grow by 10.07% yearly.
- Based on estimates for the next years, SM will show a quite strong growth in Revenue. The Revenue will grow by 12.71% on average per year.
- When comparing the Revenue growth rate of the last years to the growth rate of the upcoming years, we see that the growth is accelerating.
Every day, new Decent Value stocks can be found on ChartMill in our Decent Value screener.
Our latest full fundamental report of SM contains the most current fundamental analsysis.
Disclaimer
This is not investing advice! The article highlights some of the observations at the time of writing, but you should always make your own analysis and invest based on your own insights.
28.85
-1.16 (-3.87%)
Find more stocks in the Stock Screener
SM Latest News and Analysis
 13 days ago - ChartmillNYSE:SM stands out as a stock that provides good value for the fundamentals it showcases.
SM ENERGY CO has caught the attention as a great value stock. NYSE:SM excels in profitability, solvency, and liquidity, all while being very reasonably priced.
