Should you consider SPROUTS FARMERS MARKET INC (NASDAQ:SFM) for high growth investing?
By Mill Chart
Last update: Apr 16, 2025
Our stock screener has detected a potential breakout setup on SPROUTS FARMERS MARKET INC (NASDAQ:SFM). This breakout pattern is observed when a stock consolidates following a strong upward movement. It's important to note that this pattern is based on technical analysis, and the actual breakout outcome is uncertain. However, it might be worth keeping an eye on NASDAQ:SFM.
Technical analysis of SFM
ChartMill assigns a Technical Rating to every stock. This score ranges from 0 to 10 and is updated daily. The score is determined by evaluating multiple technical indicators and properties.
Overall SFM gets a technical rating of 10 out of 10. This is due to a consistent performance in both the short and longer term time frames. Also compared to the overall market, SFM is showing a nice and steady performance.
- Both the short term and long term trends are positive. This is a very positive sign.
- Looking at the yearly performance, SFM did better than 98% of all other stocks. On top of that, SFM also shows a nice and consistent pattern of rising prices.
- SFM is part of the Consumer Staples Distribution & Retail industry. There are 40 other stocks in this industry. SFM outperforms 92% of them.
- SFM is currently trading in the upper part of its 52 week range. The market is still in the middle of its 52 week range, so SFM slightly outperforms the market at the moment.
- In the last month SFM has a been trading in the 136.20 - 163.86 range, which is quite wide. It is currently trading near the high of this range.
- Prices have been rising strongly lately, it may be a good idea to wait for a consolidation or pullback before considering an entry.
Check the latest full technical report of SFM for a complete technical analysis.
How does the Setup look for SFM
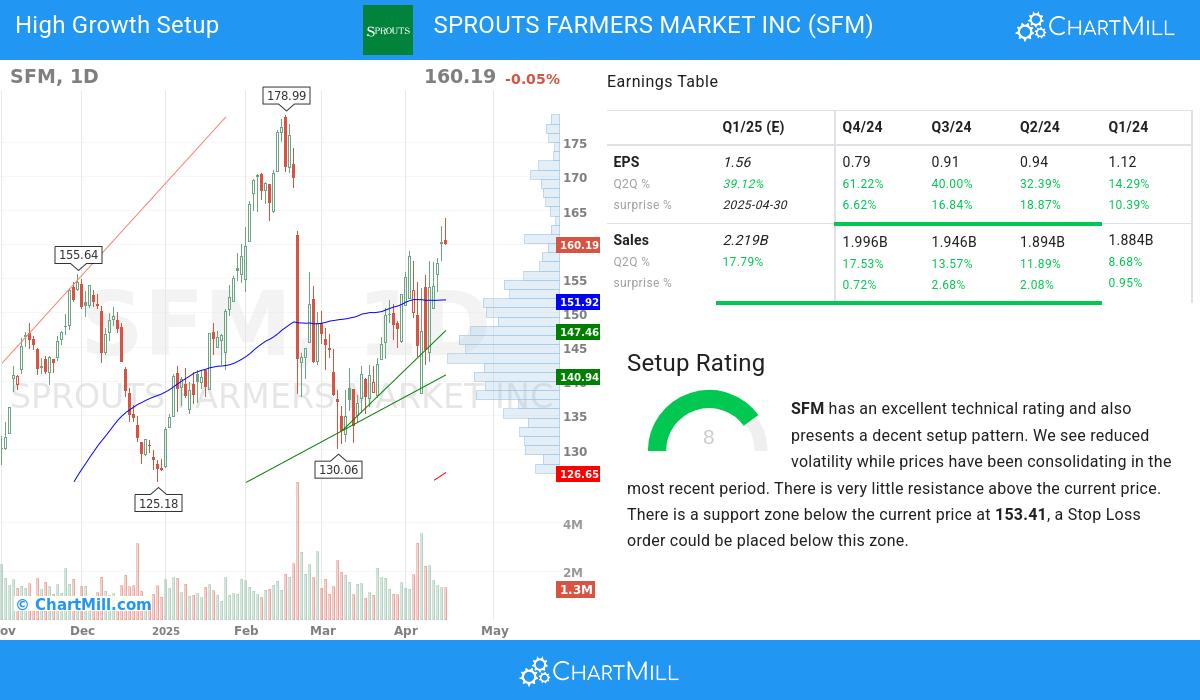
ChartMill incorporates a Setup Rating in its analysis, which measures the extent of consolidation in a stock over recent days and weeks. This rating, ranging from 0 to 10, is updated daily and takes into account multiple short-term technical indicators. The current setup rating for SFM is 8:
Besides having an excellent technical rating, SFM also presents a decent setup pattern. We see reduced volatility while prices have been consolidating in the most recent period. There is very little resistance above the current price. There is a support zone below the current price at 153.41, a Stop Loss order could be placed below this zone.
ChartMill's Evaluation of Growth
ChartMill assigns a proprietary High Growth Momentum Rating (HGM) to each stock. The score is computed by evaluating various growth and profitability aspects aspects, like EPS and revenue growth, accelleration, surprises and revisions. SFM was assigned a score of 6 for growth:
Earnings Momentum
- The quarterly earnings of SFM have shown a 61.22% increase compared to the previous quarter, as revealed in the recent financial report. This growth signifies positive momentum in the company's financials, pointing towards a promising upward trend
- SFM shows accelerating EPS growth: when comparing the current Q2Q growth of 61.22% to the previous quarter Q2Q growth of 40.0%, we see the growth rate improving.
- Sales growth accelerated for 3 quarters in a row.
- The 1-year EPS growth of SFM (32.86%) highlights the company's ability to consistently improve its earnings performance and suggests a positive outlook for future profitability.
- SFM has demonstrated strong q2q revenue growth of 17.53%, suggesting a favorable trend in the company's financials and indicating the potential for continued expansion.
- Accelerating Sales growth for SFM: the current Q2Q growth of 17.53% exceeds the previous quarter Q2Q growth of 13.57%.
- Sales acceleration happened 3 quarters in a row.
- Analysts' average next Quarter EPS Estimate for SFM has witnessed a 21.06% change in the last 3 months, underscoring the evolving market expectations towards the company's EPS prospects.
- SFM has consistently exceeded EPS estimates in the last 4 quarters, demonstrating its ability to outperform market expectations. This trend highlights the company's strong financial performance and its potential for future growth.
Profitability & Financial Strength
- With positive growth in its operating margin over the past year, SFM showcases its ability to improve profitability through effective cost control and operational efficiency. This growth underscores the company's commitment to enhancing its financial performance.
- In the past year SFM has expanded its Profit Margin, which demonstrates increasing profitability.
- SFM has shown positive growth in its free cash flow (FCF) over the past year, indicating improved cash generation and financial strength. This growth highlights the company's ability to effectively manage its cash flows and generate surplus funds.
- The Return on Equity (ROE) of SFM stands at 28.79%, reflecting the company's strong profitability and effective utilization of shareholder equity. This metric signifies the company's ability to generate returns for its investors.
- A Debt/Equity ratio of 0.01 indicates that SFM is leveraging debt effectively without excessive risk.
Market Strength
- SFM has achieved an impressive Relative Strength (RS) rating of 98.11, showcasing its ability to outperform the broader market.
More ideas for high growth momentum breakouts can be found on ChartMill in our High Growth Momentum Breakout screen.
Disclaimer
Important Note: The content of this article is not intended as trading advice. It is essential to perform your own analysis and exercise caution when making trading decisions. The article presents observations created by automated analysis but does not guarantee any trading or investment outcomes. Always trade responsibly and make independent judgments.
160.15
+0.71 (+0.45%)
Find more stocks in the Stock Screener
SFM Latest News and Analysis
 2 days ago - ChartmillShould you consider SPROUTS FARMERS MARKET INC (NASDAQ:SFM) for high growth investing?
Should you consider SPROUTS FARMERS MARKET INC (NASDAQ:SFM) for high growth investing? A fundamental and technical analysis of (NASDAQ:SFM).
