Evaluating SEA LTD-ADR (NYSE:SE) for high Growth Investment Opportunities.
By Mill Chart
Last update: Apr 26, 2025
Our stock screener has detected a potential breakout setup on SEA LTD-ADR (NYSE:SE). This breakout pattern is observed when a stock consolidates following a strong upward movement. It's important to note that this pattern is based on technical analysis, and the actual breakout outcome is uncertain. However, it might be worth keeping an eye on NYSE:SE.
What is the technical picture of SE telling us.
ChartMill assigns a proprietary Technical Rating to each stock. The score is computed daily by evaluating various technical indicators and properties. The score ranges from 0 to 10.
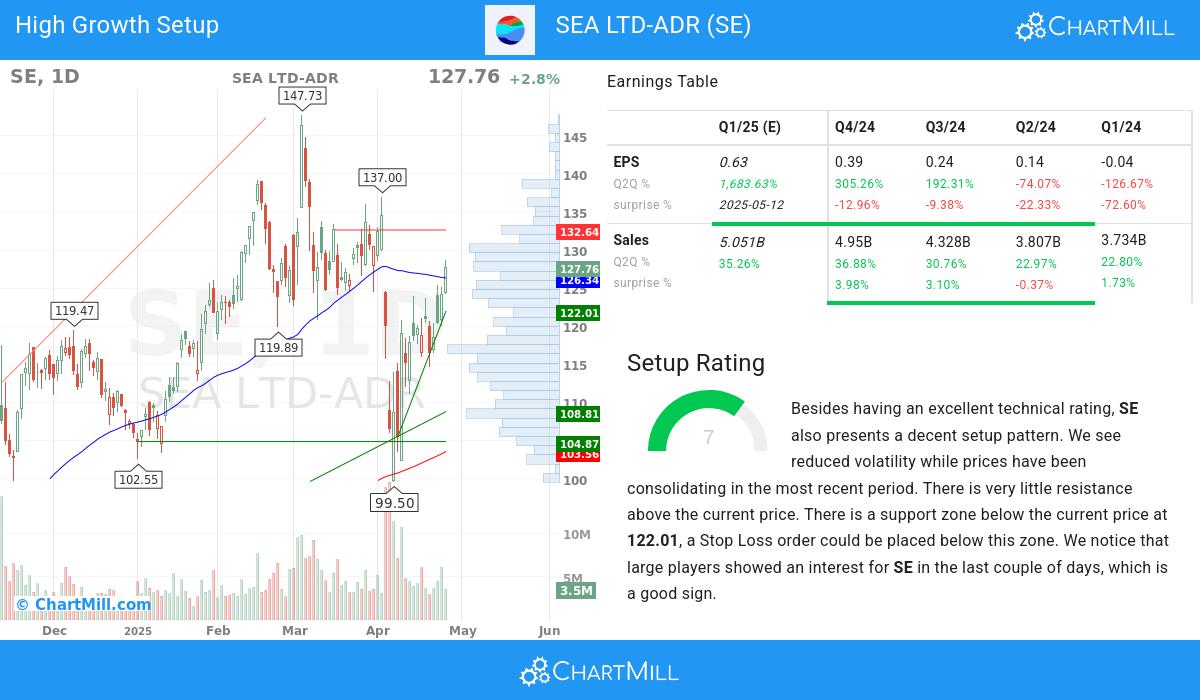
We assign a technical rating of 7 out of 10 to SE. In the last year, SE was one of the better performers, but we do observe some doubts in the very recent evolution.
- The short term is neutral, but the long term trend is still positive. Not much to worry about for now.
- Looking at the yearly performance, SE did better than 96% of all other stocks. On top of that, SE also shows a nice and consistent pattern of rising prices.
- SE is one of the better performing stocks in the Entertainment industry, it outperforms 95% of 72 stocks in the same industry.
- SE is currently trading in the upper part of its 52 week range. The market is still in the middle of its 52 week range, so SE slightly outperforms the market at the moment.
- In the last month SE has a been trading in the 99.50 - 137.00 range, which is quite wide. It is currently trading near the high of this range.
Our latest full technical report of SE contains the most current technical analsysis.
Looking at the Setup
ChartMill also assign a Setup Rating to every stock. With this score it is determined to what extend the stock has been trading in a range in the recent days and weeks. This score also ranges from 0 to 10 and is updated daily. The setup score evaluates various short term technical indicators. SE scores a 7 out of 10:
SE has an excellent technical rating and also presents a decent setup pattern. We see reduced volatility while prices have been consolidating in the most recent period. There is very little resistance above the current price. There is a support zone below the current price at 122.01, a Stop Loss order could be placed below this zone. We notice that large players showed an interest for SE in the last couple of days, which is a good sign.
Growth Examination for SE
Every stock receives a High Growth Momentum Rating (HGM) from ChartMill, ranging from 0 to 10. This rating assesses various growth and profitability aspects, including historical and projected EPS and revenue growth. SE boasts a 6 out of 10:
Earnings Momentum
- SE has shown positive momentum in its earnings per share (EPS) on a quarter-to-quarter (Q2Q) basis, with a 305.0% increase. This reflects the company's successful execution of its business strategies and its commitment to delivering improved financial results.
- SE shows accelerating EPS growth: when comparing the current Q2Q growth of 305.0% to the previous quarter Q2Q growth of 192.0%, we see the growth rate improving.
- Sales acceleration happened 3 quarters in a row.
- Over the past year, SE has demonstrated 204.0% growth in EPS, signifying its positive financial trajectory and potential for future profitability.
- SE has achieved 36.88% growth in its revenue over the previous quarter, signaling positive momentum in its financial performance and potential market opportunities.
- Accelerating Sales growth for SE: the current Q2Q growth of 36.88% exceeds the previous quarter Q2Q growth of 30.75%.
- Sales acceleration happened 3 quarters in a row.
- With notable 1-year revenue growth of 28.75%, SE exemplifies its ability to generate increased sales and revenue streams. This growth signifies the company's strong business performance and its potential for future growth.
Financial Strength & Profitability
- With a favorable trend in its operating margin over the past year, SE demonstrates its ability to enhance profitability through efficient operations. This growth reflects the company's focus on optimizing its cost structure.
- In the past year SE has expanded its Profit Margin, which demonstrates increasing profitability.
- SE has a Debt/Equity ratio of 0.68, indicating a balanced approach to financing growth.
Institutional Confidence & Market Strength
- With institutional shareholders at 66.92%, SE demonstrates a healthy ownership distribution. This reflects a mix of institutional and individual investors, creating a market environment that may foster increased trading activity and price discovery.
- The Relative Strength (RS) of SE has been consistently solid, with a current 96.81 rating. This highlights the stock's ability to exhibit sustained price strength and signifies its competitive advantage.
More ideas for high growth momentum breakouts can be found on ChartMill in our High Growth Momentum Breakout screen.
Keep in mind
This article should in no way be interpreted as advice. The article is based on the observed metrics at the time of writing, but you should always make your own analysis and trade or invest at your own responsibility.
127.76
+3.53 (+2.84%)
Find more stocks in the Stock Screener
SE Latest News and Analysis
 a few seconds ago - ChartmillEvaluating SEA LTD-ADR (NYSE:SE) for high Growth Investment Opportunities.
Why the high growth investor may take a look at SEA LTD-ADR (NYSE:SE). A fundamental and technical analysis of (NYSE:SE).
