
In a market where value is scarce, NASDAQ:RYAAY offers a refreshing opportunity with its solid fundamentals.
By Mill Chart
Last update: Oct 2, 2024
Uncover the hidden value in RYANAIR HOLDINGS PLC-SP ADR (NASDAQ:RYAAY) as our stock screening tool recommends it as an undervalued choice. NASDAQ:RYAAY maintains a robust financial position and offers an attractive pricing perspective. Let's dig deeper into the analysis.
Valuation Assessment of NASDAQ:RYAAY
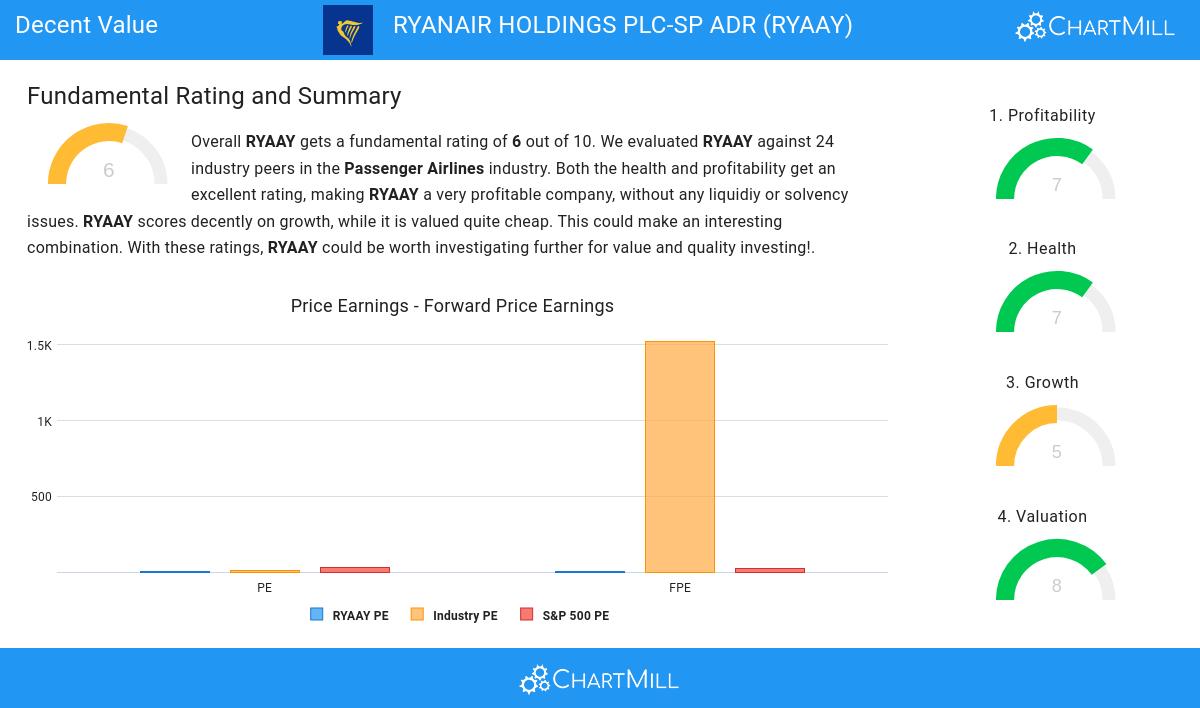
ChartMill assigns a proprietary Valuation Rating to each stock. The score is computed by evaluating various valuation aspects, like price to earnings and free cash flow, both absolutely as relative to the market and industry. NASDAQ:RYAAY was assigned a score of 8 for valuation:
- With a Price/Earnings ratio of 5.48, the valuation of RYAAY can be described as very cheap.
- Based on the Price/Earnings ratio, RYAAY is valued cheaply inside the industry as 100.00% of the companies are valued more expensively.
- The average S&P500 Price/Earnings ratio is at 31.08. RYAAY is valued rather cheaply when compared to this.
- A Price/Forward Earnings ratio of 4.57 indicates a rather cheap valuation of RYAAY.
- RYAAY's Price/Forward Earnings ratio is rather cheap when compared to the industry. RYAAY is cheaper than 95.83% of the companies in the same industry.
- The average S&P500 Price/Forward Earnings ratio is at 22.39. RYAAY is valued rather cheaply when compared to this.
- Compared to the rest of the industry, the Enterprise Value to EBITDA ratio of RYAAY indicates a rather cheap valuation: RYAAY is cheaper than 100.00% of the companies listed in the same industry.
- RYAAY's Price/Free Cash Flow ratio is rather cheap when compared to the industry. RYAAY is cheaper than 83.33% of the companies in the same industry.
- RYAAY has a very decent profitability rating, which may justify a higher PE ratio.
Profitability Examination for NASDAQ:RYAAY
ChartMill assigns a proprietary Profitability Rating to each stock. The score is computed by evaluating various profitability ratios and margins and ranges from 0 to 10. NASDAQ:RYAAY was assigned a score of 7 for profitability:
- RYAAY has a better Return On Assets (11.16%) than 95.83% of its industry peers.
- RYAAY has a Return On Equity of 25.18%. This is in the better half of the industry: RYAAY outperforms 79.17% of its industry peers.
- Looking at the Return On Invested Capital, with a value of 17.32%, RYAAY belongs to the top of the industry, outperforming 95.83% of the companies in the same industry.
- With an excellent Profit Margin value of 14.26%, RYAAY belongs to the best of the industry, outperforming 95.83% of the companies in the same industry.
- RYAAY's Profit Margin has improved in the last couple of years.
- RYAAY has a Operating Margin of 15.33%. This is amongst the best in the industry. RYAAY outperforms 95.83% of its industry peers.
- RYAAY's Operating Margin has improved in the last couple of years.
Understanding NASDAQ:RYAAY's Health
ChartMill employs a unique Health Rating system for all stocks. This rating, ranging from 0 to 10, is determined by analyzing various liquidity and solvency ratios. For NASDAQ:RYAAY, the assigned 7 for health provides valuable insights:
- RYAAY has a Altman-Z score of 2.17. This is amongst the best in the industry. RYAAY outperforms 83.33% of its industry peers.
- RYAAY has a debt to FCF ratio of 3.59. This is a good value and a sign of high solvency as RYAAY would need 3.59 years to pay back of all of its debts.
- Looking at the Debt to FCF ratio, with a value of 3.59, RYAAY belongs to the top of the industry, outperforming 95.83% of the companies in the same industry.
- RYAAY has a Debt/Equity ratio of 0.35. This is a healthy value indicating a solid balance between debt and equity.
- RYAAY has a Debt to Equity ratio of 0.35. This is amongst the best in the industry. RYAAY outperforms 91.67% of its industry peers.
- The Current ratio of RYAAY (0.91) is better than 83.33% of its industry peers.
- The Quick ratio of RYAAY (0.91) is better than 87.50% of its industry peers.
How do we evaluate the Growth for NASDAQ:RYAAY?
ChartMill assigns a proprietary Growth Rating to each stock. The score is computed by evaluating various growth aspects, like EPS and revenue growth. We take into account the history as well as the estimated future numbers. NASDAQ:RYAAY was assigned a score of 5 for growth:
- RYAAY shows quite a strong growth in Earnings Per Share. Measured over the last years, the EPS has been growing by 16.75% yearly.
- RYAAY shows a strong growth in Revenue. In the last year, the Revenue has grown by 24.77%.
- The Revenue has been growing by 11.80% on average over the past years. This is quite good.
- The Earnings Per Share is expected to grow by 10.54% on average over the next years. This is quite good.
More Decent Value stocks can be found in our Decent Value screener.
For an up to date full fundamental analysis you can check the fundamental report of RYAAY
Keep in mind
This is not investing advice! The article highlights some of the observations at the time of writing, but you should always make your own analysis and invest based on your own insights.
