
NASDAQ:QFIN is showing good growth, while it is not too expensive.
By Mill Chart
Last update: Oct 24, 2024
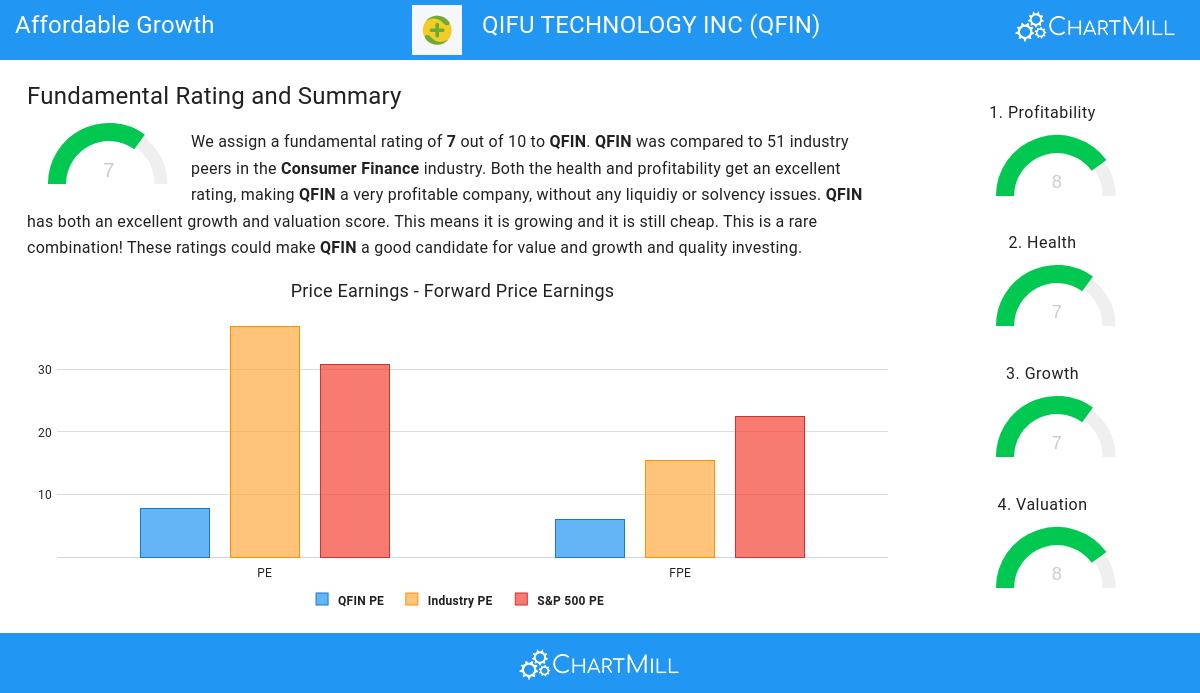
QIFU TECHNOLOGY INC (NASDAQ:QFIN) has caught the eye of our stock screener as an affordable growth stock. NASDAQ:QFIN is displaying robust growth metrics and also excels in terms of profitability, solvency, and liquidity. Additionally, it appears to be reasonably priced. Let's delve into the details.
Understanding NASDAQ:QFIN's Growth
Every stock receives a Growth Rating from ChartMill, ranging from 0 to 10. This rating assesses various growth aspects, including historical and projected EPS and revenue growth. NASDAQ:QFIN boasts a 7 out of 10:
- The Earnings Per Share has grown by an impressive 24.11% over the past year.
- QFIN shows quite a strong growth in Revenue. In the last year, the Revenue has grown by 9.80%.
- Measured over the past years, QFIN shows a very strong growth in Revenue. The Revenue has been growing by 29.65% on average per year.
- Based on estimates for the next years, QFIN will show a quite strong growth in Earnings Per Share. The EPS will grow by 19.12% on average per year.
- Based on estimates for the next years, QFIN will show a quite strong growth in Revenue. The Revenue will grow by 8.18% on average per year.
- When comparing the EPS growth rate of the last years to the growth rate of the upcoming years, we see that the growth is accelerating.
Evaluating Valuation: NASDAQ:QFIN
ChartMill provides a Valuation Rating to every stock, ranging from 0 to 10. This rating assesses various valuation aspects, comparing price to earnings and cash flows, while considering factors like profitability and growth. NASDAQ:QFIN boasts a 8 out of 10:
- The Price/Earnings ratio is 7.76, which indicates a rather cheap valuation of QFIN.
- Based on the Price/Earnings ratio, QFIN is valued a bit cheaper than 76.47% of the companies in the same industry.
- When comparing the Price/Earnings ratio of QFIN to the average of the S&P500 Index (30.80), we can say QFIN is valued rather cheaply.
- The Price/Forward Earnings ratio is 6.01, which indicates a rather cheap valuation of QFIN.
- Based on the Price/Forward Earnings ratio, QFIN is valued a bit cheaper than the industry average as 78.43% of the companies are valued more expensively.
- When comparing the Price/Forward Earnings ratio of QFIN to the average of the S&P500 Index (22.48), we can say QFIN is valued rather cheaply.
- Based on the Enterprise Value to EBITDA ratio, QFIN is valued cheaper than 84.31% of the companies in the same industry.
- The low PEG Ratio(NY), which compensates the Price/Earnings for growth, indicates a rather cheap valuation of the company.
- The excellent profitability rating of QFIN may justify a higher PE ratio.
- QFIN's earnings are expected to grow with 19.12% in the coming years. This may justify a more expensive valuation.
Analyzing Health Metrics
ChartMill assigns a proprietary Health Rating to each stock. The score is computed by evaluating various liquidity and solvency ratios and ranges from 0 to 10. NASDAQ:QFIN was assigned a score of 7 for health:
- QFIN has a debt to FCF ratio of 0.14. This is a very positive value and a sign of high solvency as it would only need 0.14 years to pay back of all of its debts.
- The Debt to FCF ratio of QFIN (0.14) is better than 94.12% of its industry peers.
- A Debt/Equity ratio of 0.05 indicates that QFIN is not too dependend on debt financing.
- QFIN has a Debt to Equity ratio of 0.05. This is amongst the best in the industry. QFIN outperforms 86.27% of its industry peers.
- QFIN has a Current Ratio of 2.45. This indicates that QFIN is financially healthy and has no problem in meeting its short term obligations.
- QFIN has a better Current ratio (2.45) than 76.47% of its industry peers.
- QFIN has a Quick Ratio of 2.45. This indicates that QFIN is financially healthy and has no problem in meeting its short term obligations.
- The Quick ratio of QFIN (2.45) is better than 78.43% of its industry peers.
Exploring NASDAQ:QFIN's Profitability
ChartMill assigns a proprietary Profitability Rating to each stock. The score is computed by evaluating various profitability ratios and margins and ranges from 0 to 10. NASDAQ:QFIN was assigned a score of 8 for profitability:
- QFIN's Return On Assets of 10.21% is amongst the best of the industry. QFIN outperforms 94.12% of its industry peers.
- The Return On Equity of QFIN (21.26%) is better than 86.27% of its industry peers.
- QFIN's Return On Invested Capital of 15.97% is amongst the best of the industry. QFIN outperforms 92.16% of its industry peers.
- QFIN had an Average Return On Invested Capital over the past 3 years of 19.66%. This is significantly above the industry average of 7.17%.
- The Profit Margin of QFIN (28.08%) is better than 92.16% of its industry peers.
- QFIN has a better Operating Margin (35.21%) than 96.08% of its industry peers.
- The Gross Margin of QFIN (83.44%) is better than 82.35% of its industry peers.
More Affordable Growth stocks can be found in our Affordable Growth screener.
Our latest full fundamental report of QFIN contains the most current fundamental analsysis.
Keep in mind
This is not investing advice! The article highlights some of the observations at the time of writing, but you should always make your own analysis and invest based on your own insights.
NASDAQ:QFIN (12/16/2025, 11:49:47 AM)
18.965
-0.25 (-1.28%)
Find more stocks in the Stock Screener
QFIN Latest News and Analysis


