
Despite its growth, NASDAQ:QFIN remains within the realm of affordability.
By Mill Chart
Last update: Oct 3, 2024
Take a closer look at QIFU TECHNOLOGY INC (NASDAQ:QFIN), an affordable growth stock uncovered by our stock screener. NASDAQ:QFIN boasts strong growth prospects and excels in financial health indicators, all while maintaining a reasonable valuation. Let's break it down further.
Unpacking NASDAQ:QFIN's Growth Rating
Every stock receives a Growth Rating from ChartMill, ranging from 0 to 10. This rating assesses various growth aspects, including historical and projected EPS and revenue growth. NASDAQ:QFIN boasts a 7 out of 10:
- QFIN shows a strong growth in Earnings Per Share. In the last year, the EPS has been growing by 24.11%, which is quite impressive.
- Looking at the last year, QFIN shows a quite strong growth in Revenue. The Revenue has grown by 9.80% in the last year.
- QFIN shows a strong growth in Revenue. Measured over the last years, the Revenue has been growing by 29.65% yearly.
- The Earnings Per Share is expected to grow by 19.12% on average over the next years. This is quite good.
- QFIN is expected to show quite a strong growth in Revenue. In the coming years, the Revenue will grow by 8.18% yearly.
- The EPS growth rate is accelerating: in the next years the growth will be better than in the last years.
How do we evaluate the Valuation for NASDAQ:QFIN?
An integral part of ChartMill's stock analysis is the Valuation Rating, which spans from 0 to 10. This rating evaluates diverse valuation factors, including price to earnings and cash flows, while considering the stock's profitability and growth. NASDAQ:QFIN has received a 8 out of 10:
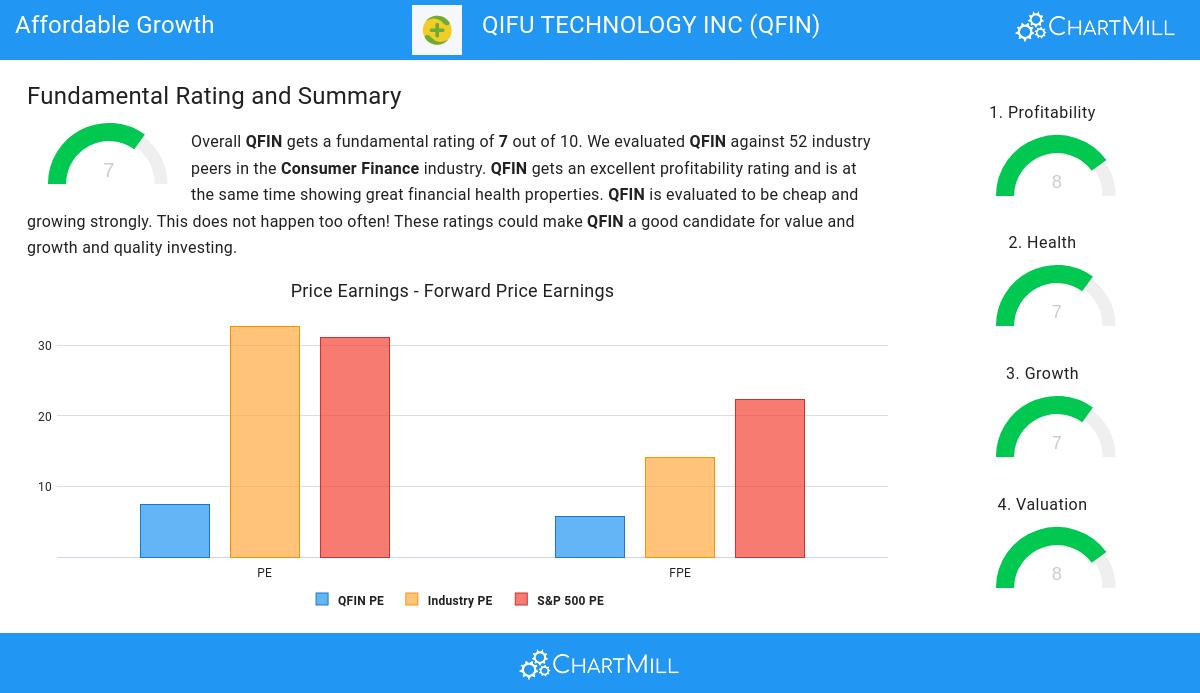
- QFIN is valuated cheaply with a Price/Earnings ratio of 7.49.
- Based on the Price/Earnings ratio, QFIN is valued a bit cheaper than 75.00% of the companies in the same industry.
- QFIN's Price/Earnings ratio indicates a rather cheap valuation when compared to the S&P500 average which is at 31.01.
- The Price/Forward Earnings ratio is 5.80, which indicates a rather cheap valuation of QFIN.
- Based on the Price/Forward Earnings ratio, QFIN is valued cheaply inside the industry as 80.77% of the companies are valued more expensively.
- The average S&P500 Price/Forward Earnings ratio is at 22.36. QFIN is valued rather cheaply when compared to this.
- QFIN's Enterprise Value to EBITDA ratio is rather cheap when compared to the industry. QFIN is cheaper than 84.62% of the companies in the same industry.
- QFIN's low PEG Ratio(NY), which compensates the Price/Earnings for growth, indicates a rather cheap valuation of the company.
- The excellent profitability rating of QFIN may justify a higher PE ratio.
- QFIN's earnings are expected to grow with 19.12% in the coming years. This may justify a more expensive valuation.
Unpacking NASDAQ:QFIN's Health Rating
ChartMill employs its own Health Rating for stock assessment. This rating, ranging from 0 to 10, is calculated by examining various liquidity and solvency ratios. In the case of NASDAQ:QFIN, the assigned 7 reflects its health status:
- The Debt to FCF ratio of QFIN is 0.14, which is an excellent value as it means it would take QFIN, only 0.14 years of fcf income to pay off all of its debts.
- Looking at the Debt to FCF ratio, with a value of 0.14, QFIN belongs to the top of the industry, outperforming 94.23% of the companies in the same industry.
- QFIN has a Debt/Equity ratio of 0.05. This is a healthy value indicating a solid balance between debt and equity.
- QFIN has a Debt to Equity ratio of 0.05. This is amongst the best in the industry. QFIN outperforms 84.62% of its industry peers.
- QFIN has a Current Ratio of 2.45. This indicates that QFIN is financially healthy and has no problem in meeting its short term obligations.
- QFIN's Current ratio of 2.45 is fine compared to the rest of the industry. QFIN outperforms 75.00% of its industry peers.
- QFIN has a Quick Ratio of 2.45. This indicates that QFIN is financially healthy and has no problem in meeting its short term obligations.
- The Quick ratio of QFIN (2.45) is better than 76.92% of its industry peers.
Profitability Insights: NASDAQ:QFIN
ChartMill assigns a proprietary Profitability Rating to each stock. The score is computed by evaluating various profitability ratios and margins and ranges from 0 to 10. NASDAQ:QFIN was assigned a score of 8 for profitability:
- The Return On Assets of QFIN (10.21%) is better than 94.23% of its industry peers.
- With an excellent Return On Equity value of 21.26%, QFIN belongs to the best of the industry, outperforming 86.54% of the companies in the same industry.
- QFIN has a Return On Invested Capital of 15.97%. This is amongst the best in the industry. QFIN outperforms 92.31% of its industry peers.
- Measured over the past 3 years, the Average Return On Invested Capital for QFIN is significantly above the industry average of 7.17%.
- QFIN has a Profit Margin of 28.08%. This is amongst the best in the industry. QFIN outperforms 92.31% of its industry peers.
- With an excellent Operating Margin value of 35.21%, QFIN belongs to the best of the industry, outperforming 96.15% of the companies in the same industry.
- QFIN has a Gross Margin of 83.44%. This is amongst the best in the industry. QFIN outperforms 82.69% of its industry peers.
Our Affordable Growth screener lists more Affordable Growth stocks and is updated daily.
For an up to date full fundamental analysis you can check the fundamental report of QFIN
Keep in mind
This article should in no way be interpreted as advice. The article is based on the observed metrics at the time of writing, but you should always make your own analysis and trade or invest at your own responsibility.
18.99
+0.01 (+0.05%)
Find more stocks in the Stock Screener
QFIN Latest News and Analysis

