Analyzing QUALCOMM INC (NASDAQ:QCOM)'s Dividend Potential.
By Mill Chart
Last update: Mar 24, 2025
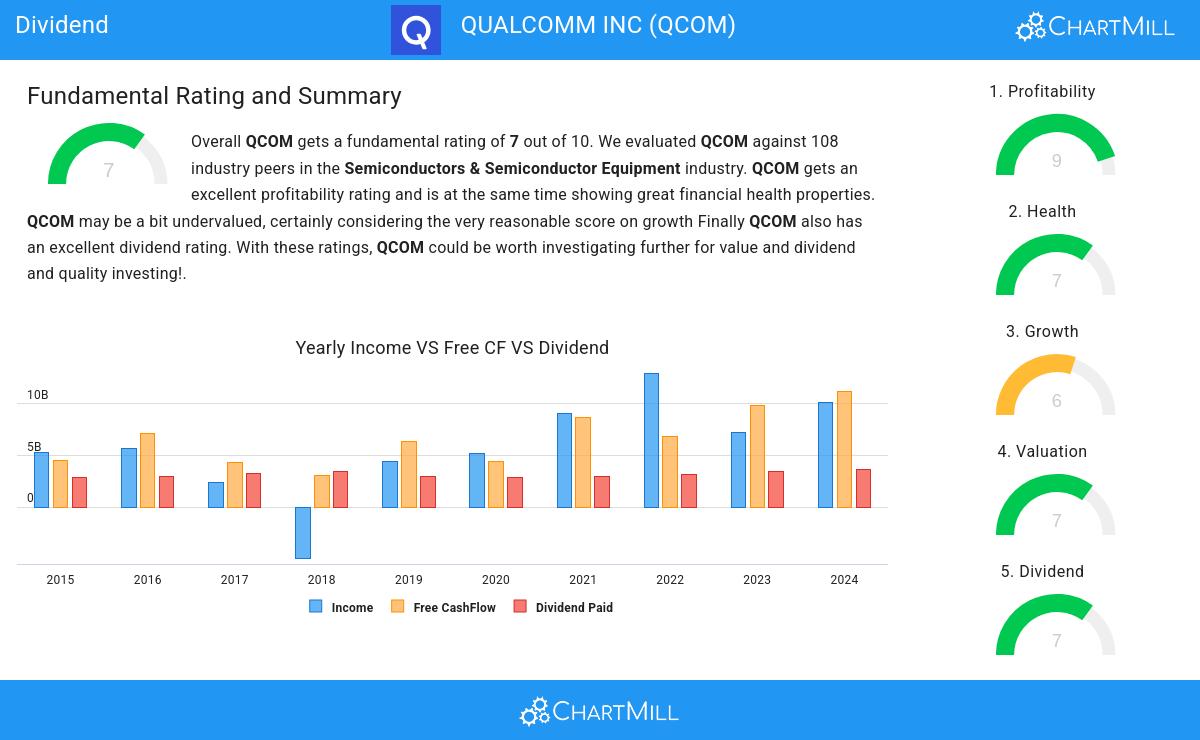
Our stock screening tool has identified QUALCOMM INC (NASDAQ:QCOM) as a strong dividend contender with robust fundamentals. QCOM exhibits commendable financial health and profitability, all while offering a sustainable dividend. Let's delve into each aspect below.
Exploring QCOM's Dividend
To gauge a stock's dividend quality, ChartMill utilizes a Dividend Rating ranging from 0 to 10. This comprehensive assessment considers various dividend aspects, including yield, history, growth, and sustainability. QCOM has achieved a 7 out of 10:
- QCOM's Dividend Yield is rather good when compared to the industry average which is at 2.40. QCOM pays more dividend than 89.81% of the companies in the same industry.
- QCOM has paid a dividend for at least 10 years, which is a reliable track record.
- QCOM has not decreased their dividend for at least 10 years, which is a reliable track record.
- 35.38% of the earnings are spent on dividend by QCOM. This is a low number and sustainable payout ratio.
- QCOM's earnings are growing more than its dividend. This makes the dividend growth sustainable.
Deciphering QCOM's Health Rating
ChartMill assigns a Health Rating to every stock. This score ranges from 0 to 10 and evaluates the different health aspects like liquidity and solvency, both absolutely, but also relative to the industry peers. QCOM scores a 7 out of 10:
- An Altman-Z score of 6.02 indicates that QCOM is not in any danger for bankruptcy at the moment.
- Looking at the Altman-Z score, with a value of 6.02, QCOM is in the better half of the industry, outperforming 65.74% of the companies in the same industry.
- The Debt to FCF ratio of QCOM is 1.14, which is an excellent value as it means it would take QCOM, only 1.14 years of fcf income to pay off all of its debts.
- With a decent Debt to FCF ratio value of 1.14, QCOM is doing good in the industry, outperforming 74.07% of the companies in the same industry.
- QCOM has a Debt/Equity ratio of 0.49. This is a healthy value indicating a solid balance between debt and equity.
- Even though the debt/equity ratio score it not favorable for QCOM, it has very limited outstanding debt, so we won't put too much weight on the DE evaluation.
- QCOM has a Current Ratio of 2.62. This indicates that QCOM is financially healthy and has no problem in meeting its short term obligations.
How do we evaluate the Profitability for QCOM?
Discover ChartMill's exclusive Profitability Rating, a proprietary metric that assesses stocks on a scale of 0 to 10. It takes into consideration various profitability ratios and margins, both in absolute terms and relative to industry peers. Notably, QCOM has achieved a 9:
- QCOM has a Return On Assets of 18.99%. This is amongst the best in the industry. QCOM outperforms 91.67% of its industry peers.
- QCOM has a better Return On Equity (39.27%) than 92.59% of its industry peers.
- QCOM has a better Return On Invested Capital (18.89%) than 91.67% of its industry peers.
- The Average Return On Invested Capital over the past 3 years for QCOM is significantly above the industry average of 11.36%.
- The Profit Margin of QCOM (25.94%) is better than 86.11% of its industry peers.
- QCOM's Profit Margin has improved in the last couple of years.
- QCOM's Operating Margin of 26.80% is amongst the best of the industry. QCOM outperforms 86.11% of its industry peers.
- QCOM's Operating Margin has improved in the last couple of years.
- The Gross Margin of QCOM (55.99%) is better than 77.78% of its industry peers.
Every day, new Best Dividend stocks can be found on ChartMill in our Best Dividend screener.
Check the latest full fundamental report of QCOM for a complete fundamental analysis.
Keep in mind
This article should in no way be interpreted as advice. The article is based on the observed metrics at the time of writing, but you should always make your own analysis and trade or invest at your own responsibility.
136.66
+0.92 (+0.68%)
Find more stocks in the Stock Screener
QCOM Latest News and Analysis
 3 days ago - ChartmillWhy QUALCOMM INC (NASDAQ:QCOM) qualifies as a good dividend investing stock.
Is QUALCOMM INC (NASDAQ:QCOM) suited for dividend investing?
 9 days ago - ChartmillWhy the quality investor may take a look at QUALCOMM INC (NASDAQ:QCOM).
A fundamental analysis of (NASDAQ:QCOM): Reasonable growth and debt and a high ROIC for QUALCOMM INC (NASDAQ:QCOM).
 18 days ago - ChartmillChecking the Peter Lynch growth stock criteria for QUALCOMM INC (NASDAQ:QCOM)
Peter Lynch’s investment philosophy combines fundamental analysis with a deep understanding of business models. Let’s analyze if QUALCOMM INC (NASDAQ:QCOM) meets his criteria for a solid investment.
 21 days ago - ChartmillQUALCOMM INC (NASDAQ:QCOM) is a prime example of a stock that offers more than what meets the eye in terms of fundamentals.
QUALCOMM INC is a hidden gem, featuring undervaluation and robust fundamentals. NASDAQ:QCOM showcases decent financial health and profitability, coupled with an attractive price.
