
QUALCOMM INC (NASDAQ:QCOM) is a prime example of a stock that offers more than what meets the eye in terms of fundamentals.
By Mill Chart
Last update: Mar 28, 2025
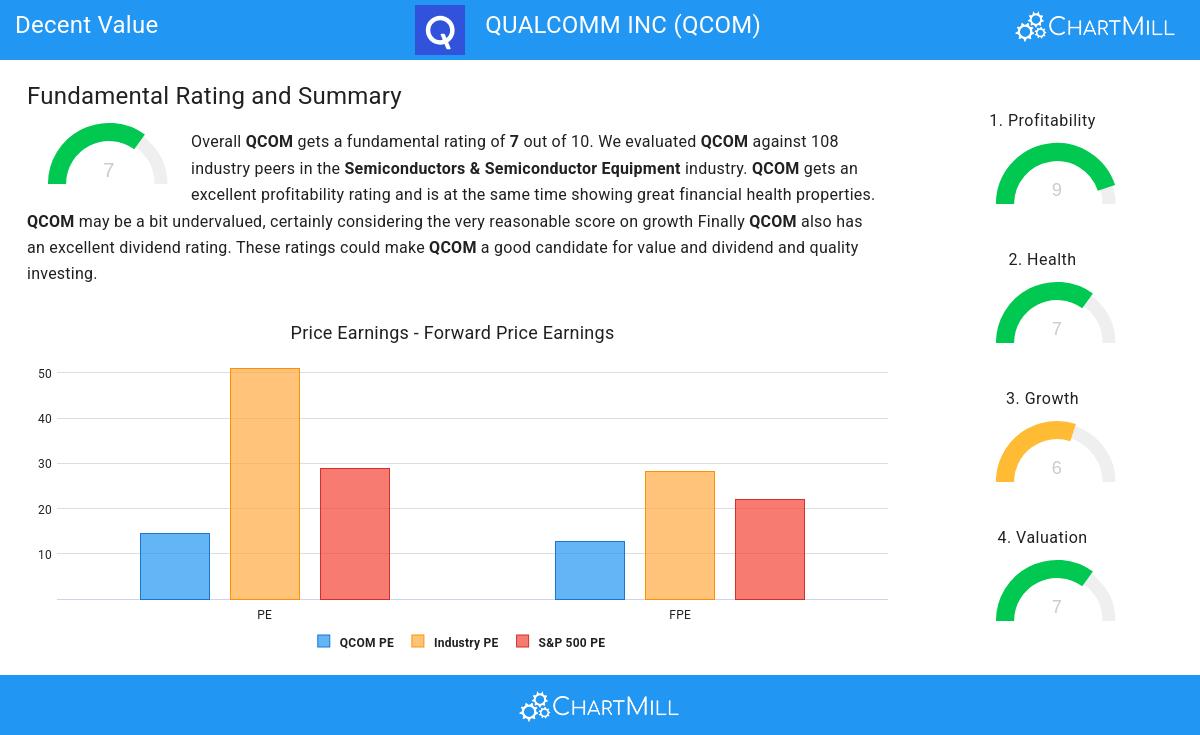
Discover QUALCOMM INC (NASDAQ:QCOM)—an undervalued stock our stock screener has picked out. QCOM demonstrates solid fundamentals, including health and profitability, all while staying attractively priced. Let's explore the details.
Assessing Valuation for QCOM
ChartMill employs its own Valuation Rating system for all stocks. This score, ranging from 0 to 10, is determined by evaluating different valuation factors, including price to earnings and free cash flow, both in absolute terms and relative to the market and industry. QCOM has earned a 7 for valuation:
- QCOM's Price/Earnings ratio is rather cheap when compared to the industry. QCOM is cheaper than 84.26% of the companies in the same industry.
- The average S&P500 Price/Earnings ratio is at 28.80. QCOM is valued slightly cheaper when compared to this.
- Based on the Price/Forward Earnings ratio, QCOM is valued cheaply inside the industry as 92.59% of the companies are valued more expensively.
- When comparing the Price/Forward Earnings ratio of QCOM to the average of the S&P500 Index (21.91), we can say QCOM is valued slightly cheaper.
- Based on the Enterprise Value to EBITDA ratio, QCOM is valued a bit cheaper than 75.93% of the companies in the same industry.
- Compared to the rest of the industry, the Price/Free Cash Flow ratio of QCOM indicates a rather cheap valuation: QCOM is cheaper than 94.44% of the companies listed in the same industry.
- QCOM's low PEG Ratio(NY), which compensates the Price/Earnings for growth, indicates a rather cheap valuation of the company.
- The excellent profitability rating of QCOM may justify a higher PE ratio.
Profitability Analysis for QCOM
ChartMill assigns a proprietary Profitability Rating to each stock. The score is computed by evaluating various profitability ratios and margins and ranges from 0 to 10. QCOM was assigned a score of 9 for profitability:
- Looking at the Return On Assets, with a value of 18.99%, QCOM belongs to the top of the industry, outperforming 91.67% of the companies in the same industry.
- QCOM has a better Return On Equity (39.27%) than 92.59% of its industry peers.
- With an excellent Return On Invested Capital value of 18.89%, QCOM belongs to the best of the industry, outperforming 91.67% of the companies in the same industry.
- Measured over the past 3 years, the Average Return On Invested Capital for QCOM is significantly above the industry average of 11.38%.
- QCOM's Profit Margin of 25.94% is amongst the best of the industry. QCOM outperforms 86.11% of its industry peers.
- In the last couple of years the Profit Margin of QCOM has grown nicely.
- With an excellent Operating Margin value of 26.80%, QCOM belongs to the best of the industry, outperforming 86.11% of the companies in the same industry.
- In the last couple of years the Operating Margin of QCOM has grown nicely.
- Looking at the Gross Margin, with a value of 55.99%, QCOM is in the better half of the industry, outperforming 77.78% of the companies in the same industry.
Evaluating Health: QCOM
A critical element of ChartMill's stock evaluation is the Health Rating, which spans from 0 to 10. This rating considers multiple health factors, including liquidity and solvency, both in absolute terms and relative to industry peers. QCOM has received a 7 out of 10:
- QCOM has an Altman-Z score of 6.05. This indicates that QCOM is financially healthy and has little risk of bankruptcy at the moment.
- QCOM's Altman-Z score of 6.05 is fine compared to the rest of the industry. QCOM outperforms 68.52% of its industry peers.
- The Debt to FCF ratio of QCOM is 1.14, which is an excellent value as it means it would take QCOM, only 1.14 years of fcf income to pay off all of its debts.
- The Debt to FCF ratio of QCOM (1.14) is better than 74.07% of its industry peers.
- A Debt/Equity ratio of 0.49 indicates that QCOM is not too dependend on debt financing.
- Although QCOM does not score too well on debt/equity it has very limited outstanding debt, which is well covered by the FCF. We will not put too much weight on the debt/equity number as it may be because of low equity, which could be a consequence of a share buyback program for instance. This needs to be investigated.
- QCOM has a Current Ratio of 2.62. This indicates that QCOM is financially healthy and has no problem in meeting its short term obligations.
Growth Analysis for QCOM
ChartMill assigns a Growth Rating to every stock. This score ranges from 0 to 10 and evaluates the different growth aspects like EPS and Revenue, both in the past as in the future. QCOM scores a 6 out of 10:
- The Earnings Per Share has grown by an impressive 23.66% over the past year.
- QCOM shows a strong growth in Earnings Per Share. Measured over the last years, the EPS has been growing by 23.53% yearly.
- The Revenue has grown by 12.13% in the past year. This is quite good.
- QCOM shows quite a strong growth in Revenue. Measured over the last years, the Revenue has been growing by 14.76% yearly.
- Based on estimates for the next years, QCOM will show a quite strong growth in Earnings Per Share. The EPS will grow by 10.12% on average per year.
More Decent Value stocks can be found in our Decent Value screener.
For an up to date full fundamental analysis you can check the fundamental report of QCOM
Keep in mind
Important Note: The content of this article is not intended as trading advice. It is essential to perform your own analysis and exercise caution when making trading decisions. The article presents observations created by automated analysis but does not guarantee any trading or investment outcomes. Always trade responsibly and make independent judgments.
136.66
+0.92 (+0.68%)
Find more stocks in the Stock Screener
QCOM Latest News and Analysis
 4 days ago - ChartmillWhy QUALCOMM INC (NASDAQ:QCOM) qualifies as a good dividend investing stock.
Is QUALCOMM INC (NASDAQ:QCOM) suited for dividend investing?
 10 days ago - ChartmillWhy the quality investor may take a look at QUALCOMM INC (NASDAQ:QCOM).
A fundamental analysis of (NASDAQ:QCOM): Reasonable growth and debt and a high ROIC for QUALCOMM INC (NASDAQ:QCOM).
 19 days ago - ChartmillChecking the Peter Lynch growth stock criteria for QUALCOMM INC (NASDAQ:QCOM)
Peter Lynch’s investment philosophy combines fundamental analysis with a deep understanding of business models. Let’s analyze if QUALCOMM INC (NASDAQ:QCOM) meets his criteria for a solid investment.
