NASDAQ:QCOM, an undervalued stock with good fundamentals.
By Mill Chart
Last update: Oct 22, 2024
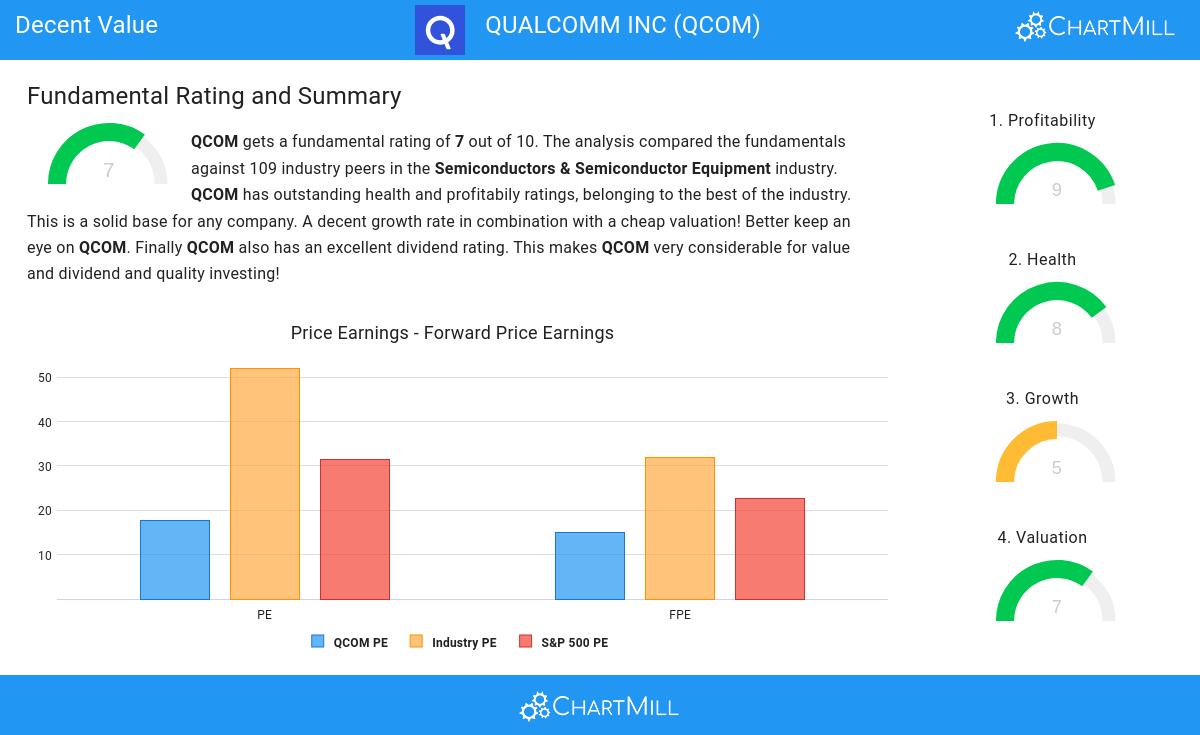
QUALCOMM INC (NASDAQ:QCOM) has caught the attention of our stock screener as a great value stock. NASDAQ:QCOM excels in profitability, solvency, and liquidity, all while being very reasonably priced. Let's delve into the details.
Valuation Assessment of NASDAQ:QCOM
ChartMill employs its own Valuation Rating system for all stocks. This score, ranging from 0 to 10, is determined by evaluating different valuation factors, including price to earnings and free cash flow, both in absolute terms and relative to the market and industry. NASDAQ:QCOM has earned a 7 for valuation:
- QCOM's Price/Earnings ratio is rather cheap when compared to the industry. QCOM is cheaper than 83.49% of the companies in the same industry.
- The average S&P500 Price/Earnings ratio is at 31.46. QCOM is valued slightly cheaper when compared to this.
- Compared to the rest of the industry, the Price/Forward Earnings ratio of QCOM indicates a rather cheap valuation: QCOM is cheaper than 81.65% of the companies listed in the same industry.
- The average S&P500 Price/Forward Earnings ratio is at 22.63. QCOM is valued slightly cheaper when compared to this.
- Based on the Enterprise Value to EBITDA ratio, QCOM is valued a bit cheaper than 76.15% of the companies in the same industry.
- QCOM's Price/Free Cash Flow ratio is rather cheap when compared to the industry. QCOM is cheaper than 90.83% of the companies in the same industry.
- QCOM's low PEG Ratio(NY), which compensates the Price/Earnings for growth, indicates a rather cheap valuation of the company.
- The excellent profitability rating of QCOM may justify a higher PE ratio.
- A more expensive valuation may be justified as QCOM's earnings are expected to grow with 13.76% in the coming years.
Understanding NASDAQ:QCOM's Profitability
ChartMill's Profitability Rating offers a unique perspective on stock analysis, providing scores from 0 to 10. These ratings consider a wide range of profitability metrics and margins, both in comparison to industry peers and on their own merits. For NASDAQ:QCOM, the assigned 9 is a significant indicator of profitability:
- QCOM has a Return On Assets of 16.52%. This is amongst the best in the industry. QCOM outperforms 88.99% of its industry peers.
- The Return On Equity of QCOM (35.31%) is better than 95.41% of its industry peers.
- The Return On Invested Capital of QCOM (17.50%) is better than 91.74% of its industry peers.
- The Average Return On Invested Capital over the past 3 years for QCOM is significantly above the industry average of 10.66%.
- The last Return On Invested Capital (17.50%) for QCOM is well below the 3 year average (24.51%), which needs to be investigated, but indicates that QCOM had better years and this may not be a problem.
- QCOM's Profit Margin of 23.33% is amongst the best of the industry. QCOM outperforms 83.49% of its industry peers.
- QCOM has a better Operating Margin (25.50%) than 84.40% of its industry peers.
- In the last couple of years the Operating Margin of QCOM has grown nicely.
- QCOM has a better Gross Margin (55.90%) than 77.06% of its industry peers.
Health Analysis for NASDAQ:QCOM
ChartMill employs a unique Health Rating system for all stocks. This rating, ranging from 0 to 10, is determined by analyzing various liquidity and solvency ratios. For NASDAQ:QCOM, the assigned 8 for health provides valuable insights:
- QCOM has an Altman-Z score of 6.28. This indicates that QCOM is financially healthy and has little risk of bankruptcy at the moment.
- QCOM's Altman-Z score of 6.28 is fine compared to the rest of the industry. QCOM outperforms 64.22% of its industry peers.
- The Debt to FCF ratio of QCOM is 1.16, which is an excellent value as it means it would take QCOM, only 1.16 years of fcf income to pay off all of its debts.
- With a decent Debt to FCF ratio value of 1.16, QCOM is doing good in the industry, outperforming 77.98% of the companies in the same industry.
- Although QCOM does not score too well on debt/equity it has very limited outstanding debt, which is well covered by the FCF. We will not put too much weight on the debt/equity number as it may be because of low equity, which could be a consequence of a share buyback program for instance. This needs to be investigated.
- A Current Ratio of 2.39 indicates that QCOM has no problem at all paying its short term obligations.
- QCOM does not score too well on the current and quick ratio evaluation. However, as it has excellent solvency and profitability, these ratios do not necessarly indicate liquidity issues and need to be evaluated against the specifics of the business.
Understanding NASDAQ:QCOM's Growth
Every stock receives a Growth Rating from ChartMill, ranging from 0 to 10. This rating assesses various growth aspects, including historical and projected EPS and revenue growth. NASDAQ:QCOM boasts a 5 out of 10:
- QCOM shows quite a strong growth in Earnings Per Share. Measured over the last years, the EPS has been growing by 19.65% yearly.
- Measured over the past years, QCOM shows a quite strong growth in Revenue. The Revenue has been growing by 9.64% on average per year.
- Based on estimates for the next years, QCOM will show a quite strong growth in Earnings Per Share. The EPS will grow by 10.30% on average per year.
More Decent Value stocks can be found in our Decent Value screener.
Check the latest full fundamental report of QCOM for a complete fundamental analysis.
Disclaimer
This is not investing advice! The article highlights some of the observations at the time of writing, but you should always make your own analysis and invest based on your own insights.
175.22
+1.58 (+0.91%)
Find more stocks in the Stock Screener
QCOM Latest News and Analysis
 8 days ago - ChartmillShould Quality Investors Include NASDAQ:QCOM in Their Portfolio?
A fundamental analysis of (NASDAQ:QCOM): Examining the Quality Attributes of NASDAQ:QCOM.
 8 days ago - ChartmillFor those who appreciate value investing, NASDAQ:QCOM is a compelling option with its solid fundamentals.
Uncover the potential of QUALCOMM INC, an undervalued stock. NASDAQ:QCOM maintains a strong financial position and offers an appealing valuation.
 13 days ago - ChartmillWhich S&P500 stocks are moving on Thursday?
Wondering what's happening in today's session for the S&P500 index? Stay informed with the top movers within the S&P500 index on Thursday.
 13 days ago - ChartmillWondering what's happening in today's S&P500 pre-market session?
Let's have a look at what is happening on the US markets before the opening bell on Thursday. Below you can find the top S&P500 gainers and losers in today's pre-market session.
 13 days ago - ChartmillIs NASDAQ:QCOM suited for dividend investing?
Is QUALCOMM INC (NASDAQ:QCOM) a Good Fit for Dividend Investing?
 14 days ago - ChartmillWhich S&P500 stocks are moving after the closing bell on Wednesday?
Discover the top S&P500 movers in Wednesday's after-hours session and stay informed about the post-market dynamics.
