
For those who appreciate value investing, NASDAQ:QCOM is a compelling option with its solid fundamentals.
By Mill Chart
Last update: Feb 11, 2025
Our stock screening tool has identified QUALCOMM INC (NASDAQ:QCOM) as an undervalued gem with strong fundamentals. NASDAQ:QCOM boasts decent financial health and profitability while maintaining an attractive price point. We'll break it down further.
Valuation Assessment of NASDAQ:QCOM
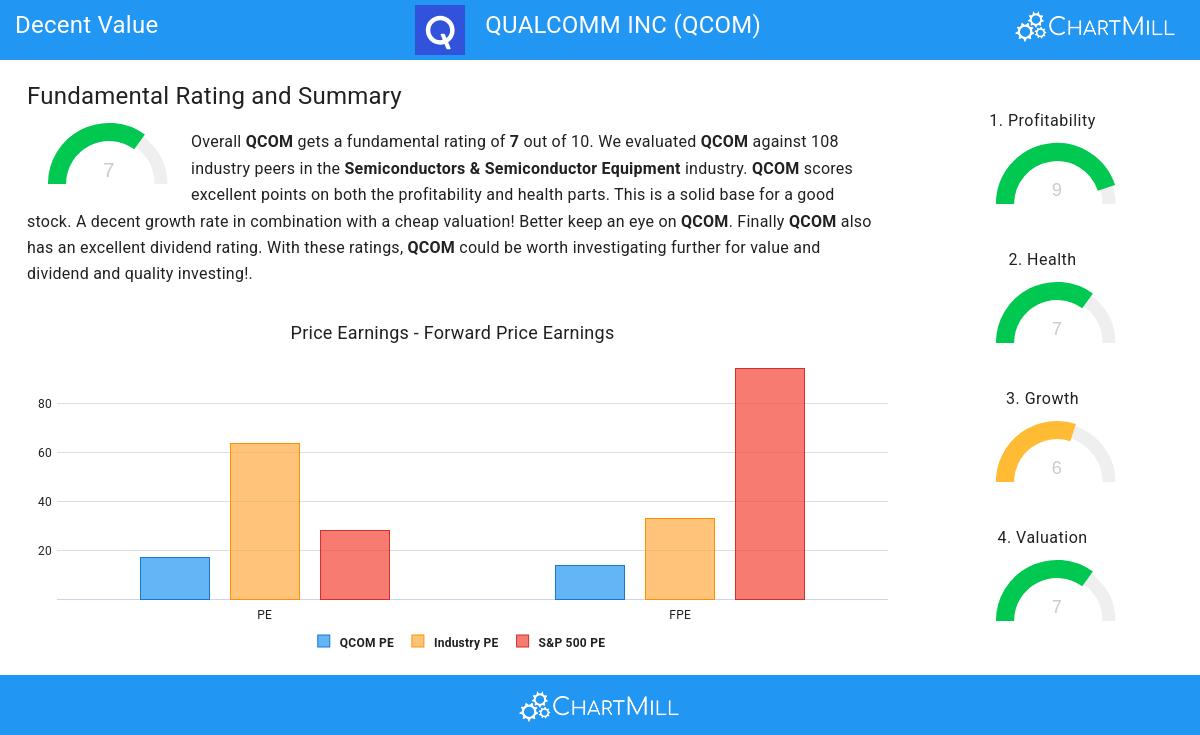
ChartMill assigns a proprietary Valuation Rating to each stock. The score is computed by evaluating various valuation aspects, like price to earnings and free cash flow, both absolutely as relative to the market and industry. NASDAQ:QCOM was assigned a score of 7 for valuation:
- Based on the Price/Earnings ratio, QCOM is valued cheaply inside the industry as 84.26% of the companies are valued more expensively.
- The average S&P500 Price/Earnings ratio is at 28.20. QCOM is valued slightly cheaper when compared to this.
- Compared to the rest of the industry, the Price/Forward Earnings ratio of QCOM indicates a rather cheap valuation: QCOM is cheaper than 89.81% of the companies listed in the same industry.
- QCOM is valuated cheaply when we compare the Price/Forward Earnings ratio to 94.48, which is the current average of the S&P500 Index.
- QCOM's Enterprise Value to EBITDA ratio is a bit cheaper when compared to the industry. QCOM is cheaper than 76.85% of the companies in the same industry.
- QCOM's Price/Free Cash Flow ratio is rather cheap when compared to the industry. QCOM is cheaper than 93.52% of the companies in the same industry.
- The excellent profitability rating of QCOM may justify a higher PE ratio.
Exploring NASDAQ:QCOM's Profitability
Discover ChartMill's exclusive Profitability Rating, a proprietary metric that assesses stocks on a scale of 0 to 10. It takes into consideration various profitability ratios and margins, both in absolute terms and relative to industry peers. Notably, NASDAQ:QCOM has achieved a 9:
- The Return On Assets of QCOM (18.99%) is better than 92.59% of its industry peers.
- QCOM has a Return On Equity of 39.27%. This is amongst the best in the industry. QCOM outperforms 93.52% of its industry peers.
- QCOM has a Return On Invested Capital of 18.89%. This is amongst the best in the industry. QCOM outperforms 90.74% of its industry peers.
- The Average Return On Invested Capital over the past 3 years for QCOM is significantly above the industry average of 12.01%.
- Looking at the Profit Margin, with a value of 25.94%, QCOM belongs to the top of the industry, outperforming 86.11% of the companies in the same industry.
- In the last couple of years the Profit Margin of QCOM has grown nicely.
- The Operating Margin of QCOM (26.80%) is better than 86.11% of its industry peers.
- In the last couple of years the Operating Margin of QCOM has grown nicely.
- Looking at the Gross Margin, with a value of 55.99%, QCOM is in the better half of the industry, outperforming 76.85% of the companies in the same industry.
ChartMill's Evaluation of Health
ChartMill employs a unique Health Rating system for all stocks. This rating, ranging from 0 to 10, is determined by analyzing various liquidity and solvency ratios. For NASDAQ:QCOM, the assigned 7 for health provides valuable insights:
- QCOM has an Altman-Z score of 6.38. This indicates that QCOM is financially healthy and has little risk of bankruptcy at the moment.
- With a decent Altman-Z score value of 6.38, QCOM is doing good in the industry, outperforming 67.59% of the companies in the same industry.
- QCOM has a debt to FCF ratio of 1.14. This is a very positive value and a sign of high solvency as it would only need 1.14 years to pay back of all of its debts.
- QCOM's Debt to FCF ratio of 1.14 is fine compared to the rest of the industry. QCOM outperforms 77.78% of its industry peers.
- A Debt/Equity ratio of 0.49 indicates that QCOM is not too dependend on debt financing.
- Although QCOM does not score too well on debt/equity it has very limited outstanding debt, which is well covered by the FCF. We will not put too much weight on the debt/equity number as it may be because of low equity, which could be a consequence of a share buyback program for instance. This needs to be investigated.
- A Current Ratio of 2.62 indicates that QCOM has no problem at all paying its short term obligations.
How We Gauge Growth for NASDAQ:QCOM
Every stock receives a Growth Rating from ChartMill, ranging from 0 to 10. This rating assesses various growth aspects, including historical and projected EPS and revenue growth. NASDAQ:QCOM boasts a 6 out of 10:
- The Earnings Per Share has grown by an impressive 21.40% over the past year.
- Measured over the past years, QCOM shows a very strong growth in Earnings Per Share. The EPS has been growing by 23.53% on average per year.
- The Revenue has grown by 12.13% in the past year. This is quite good.
- QCOM shows quite a strong growth in Revenue. Measured over the last years, the Revenue has been growing by 14.76% yearly.
- The Earnings Per Share is expected to grow by 10.61% on average over the next years. This is quite good.
Our Decent Value screener lists more Decent Value stocks and is updated daily.
For an up to date full fundamental analysis you can check the fundamental report of QCOM
Disclaimer
This article should in no way be interpreted as advice. The article is based on the observed metrics at the time of writing, but you should always make your own analysis and trade or invest at your own responsibility.
147.21
+6.75 (+4.81%)
Find more stocks in the Stock Screener
QCOM Latest News and Analysis
 a day ago - ChartmillIs QUALCOMM INC (NASDAQ:QCOM) the type of stock Peter Lynch would love?
Peter Lynch favored companies with strong earnings growth, reasonable valuations, and solid financials. In this analysis, we’ll determine if QUALCOMM INC (NASDAQ:QCOM) qualifies as a true Lynch-style investment.
 9 days ago - ChartmillWhy QUALCOMM INC (NASDAQ:QCOM) qualifies as a good dividend investing stock.
Is QUALCOMM INC (NASDAQ:QCOM) suited for dividend investing?
 15 days ago - ChartmillWhy the quality investor may take a look at QUALCOMM INC (NASDAQ:QCOM).
A fundamental analysis of (NASDAQ:QCOM): Reasonable growth and debt and a high ROIC for QUALCOMM INC (NASDAQ:QCOM).
