
Is PALANTIR TECHNOLOGIES INC-A (NYSE:PLTR) suited for high growth investing?
By Mill Chart
Last update: Oct 21, 2024
PALANTIR TECHNOLOGIES INC-A (NYSE:PLTR) was identified as a Technical Breakout Setup Pattern by our stockscreener. Such a pattern occurs when we see a pause in a strong uptrend: after a strong rise the stock is consolidating a bit and at some point the trend may be continued. Whether this actually happens can not be predicted of course, but it may be a good idea to keep and eye on NYSE:PLTR.
What is the technical picture of NYSE:PLTR telling us.
Every day, ChartMill assigns a Technical Rating to each stock, providing a score ranging from 0 to 10. This rating is determined by evaluating various technical indicators and properties.
Overall PLTR gets a technical rating of 10 out of 10. This is due to a consistent performance in both the short and longer term time frames. Also compared to the overall market, PLTR is showing a nice and steady performance.
- Both the short term and long term trends are positive. This is a very positive sign.
- When comparing the yearly performance of all stocks, we notice that PLTR is one of the better performing stocks in the market, outperforming 97% of all stocks. On top of that, PLTR also shows a nice and consistent pattern of rising prices.
- PLTR is one of the better performing stocks in the Software industry, it outperforms 95% of 282 stocks in the same industry.
- PLTR is currently trading near its 52 week high, which is a good sign. The S&P500 Index however is also trading near new highs, which makes the performance in line with the market.
- PLTR is currently showing a bull flag pattern! A bull flag pattern occurs when prices pull back slightly after a strong rise up. This may be a nice opportunity for an entry.
Check the latest full technical report of PLTR for a complete technical analysis.
Looking at the Setup
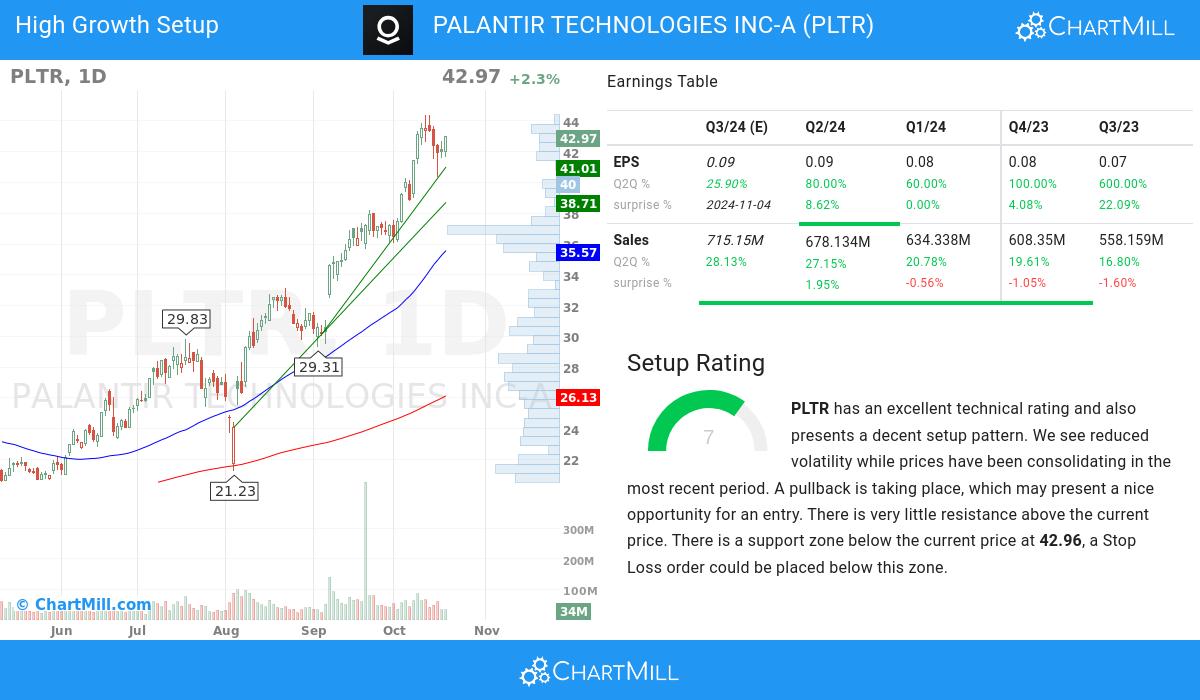
In addition to the Technical Rating, ChartMill provides a Setup Rating for each stock. This rating, ranging from 0 to 10, assesses the extent of consolidation in the stock based on multiple short-term technical indicators. Currently, NYSE:PLTR has a 7 as its setup rating:
PLTR has an excellent technical rating and also presents a decent setup pattern. Prices have been consolidating lately and the volatility has been reduced. A pullback is taking place, which may present a nice opportunity for an entry. There is very little resistance above the current price. There is a support zone below the current price at 42.96, a Stop Loss order could be placed below this zone.
Why NYSE:PLTR may be interesting for high growth investors.
- In the most recent financial report, PALANTIR TECHNOLOGIES INC-A reported a 80.0% increase in quarterly earnings compared to the previous quarter. This notable growth indicates positive momentum in the company's financials, suggesting an upward trend
- The recent q2q revenue growth of 27.15% of PALANTIR TECHNOLOGIES INC-A showcases the company's ability to generate increasing revenue in a short period, reflecting its positive growth trajectory.
- PALANTIR TECHNOLOGIES INC-A has achieved significant 1-year revenue growth of 21.22%, signaling its ability to capture market opportunities and drive top-line expansion. This growth indicates the company's effective execution and its potential for continued success.
- Analysts' average next Quarter EPS Estimate for PALANTIR TECHNOLOGIES INC-A has witnessed a 11.13% change in the last 3 months, underscoring the dynamic nature of market sentiment towards the company's EPS prospects.
- The recent financial report of PALANTIR TECHNOLOGIES INC-A demonstrates a 80.0% increase in quarterly earnings compared to the previous quarter. This growth indicates positive momentum in the company's financials and suggests a promising upward trend
- PALANTIR TECHNOLOGIES INC-A has experienced notable growth in its operating margin over the past year, reflecting improved operational performance. This growth suggests the company's ability to generate higher profits from its core business activities.
- With a favorable trend in its free cash flow (FCF) over the past year, PALANTIR TECHNOLOGIES INC-A demonstrates its ability to generate robust cash flows and maintain financial stability. This growth reflects the company's focus on efficient capital allocation and cash management.
- With a current Debt-to-Equity ratio at 0.0, PALANTIR TECHNOLOGIES INC-A showcases its disciplined capital structure. The company's prudent management of debt obligations contributes to its financial stability and long-term sustainability.
- PALANTIR TECHNOLOGIES INC-A exhibits a favorable ownership structure, with an institutional shareholder ownership of 39.93%. This signifies a diverse investor base, which can contribute to a more stable and efficient market for the stock.
- PALANTIR TECHNOLOGIES INC-A has a strong history of beating EPS estimates in the last 4 quarters, signaling its ability to consistently exceed market expectations. This indicates the company's strong financial performance and its potential for creating shareholder value.
- PALANTIR TECHNOLOGIES INC-A has exhibited strong Relative Strength(RS) in recent periods, with a current 97.83 rating. This indicates the stock's ability to outperform the broader market and reflects its competitive position. PALANTIR TECHNOLOGIES INC-A shows promising potential for continued price momentum.
More ideas for high growth momentum breakouts can be found on ChartMill in our High Growth Momentum Breakout screen.
Keep in mind
This is not investing advice! The article highlights some of the observations at the time of writing, but you should always make your own analysis and invest based on your own insights.
93.78
+1.07 (+1.15%)
Find more stocks in the Stock Screener
PLTR Latest News and Analysis
 a day ago - ChartmillThursday's session: most active stock in the S&P500 index
Looking for the most active S&P500 stocks in today's session? Join us as we dive into the US markets on Thursday and discover the stocks that are dominating the trading activity and setting the pace for the market.
a day ago - ChartmillMost active stocks in Thursday's sessionThursday's session is buzzing with activity. Check out the stocks that are attracting the most attention and driving market activity!
 2 days ago - ChartmillStay informed with the top movers within the S&P500 index on Wednesday.
Let's delve into the developments on the US markets one hour before the close of the markets on Wednesday. Below, you'll find the top gainers and losers within the S&P500 index during today's session.
2 days ago - ChartmillMost active S&P500 stocks in Wednesday's sessionStay informed about the most active S&P500 stocks in today's session as we take a closer look at what's happening on the US markets on Wednesday. Discover the stocks that are generating the highest trading volume and driving market activity.
2 days ago - ChartmillMost active stocks in Wednesday's sessionCurious about the most active stocks in today's session? Get a glimpse into the stocks that are generating the highest trading volume and capturing market attention.
2 days ago - ChartmillDiscover which S&P500 stocks are making waves on Wednesday.Let's delve into the developments on the US markets in the middle of the day on Wednesday. Below, you'll find the top gainers and losers within the S&P500 index during today's session.
 2 days ago - ChartmillWednesday's session: gap up and gap down stock in the S&P500 index
Let's take a look at the S&P500 stocks that are experiencing notable price gaps in today's session on Wednesday. Discover the gap up and gap down stocks in the S&P500 index.
 3 days ago - ChartmillMarket Monitor April 16 ( Netflix, Palantir UP, Nvidia, Applied Digital DOWN)
Calm Trading on Wall Street as Netflix Shines, Nvidia Stumbles after-hours
3 days ago - ChartmillUncover the latest developments among S&P500 stocks in today's session.Stay informed about the performance of the S&P500 index one hour before the close of the markets on Tuesday. Uncover the top gainers and losers in today's session for valuable insights.
3 days ago - ChartmillMost active S&P500 stocks in Tuesday's sessionStay informed about the most active S&P500 stocks in today's session as we take a closer look at what's happening on the US markets on Tuesday. Discover the stocks that are generating the highest trading volume and driving market activity.
3 days ago - ChartmillCurious about the most active stocks on Tuesday?Discover the most active stocks in Tuesday's session. Stay informed about the stocks that are generating the most trading volume!
3 days ago - ChartmillWhich S&P500 stocks are moving on Tuesday?Stay informed about the performance of the S&P500 index in the middle of the day on Tuesday. Uncover the top gainers and losers in today's session for valuable insights.
