NASDAQ:PLAB, an undervalued stock with good fundamentals.
By Mill Chart
Last update: Feb 6, 2025
Take a closer look at PHOTRONICS INC (NASDAQ:PLAB), a remarkable value stock uncovered by our stock screener. NASDAQ:PLAB excels in fundamentals and maintains a very reasonable valuation. Let's break it down further.
How We Gauge Valuation for NASDAQ:PLAB
ChartMill assigns a Valuation Rating to every stock. This score ranges from 0 to 10 and evaluates the different valuation aspects and compares the price to earnings and cash flows, while taking into account profitability and growth. NASDAQ:PLAB scores a 8 out of 10:
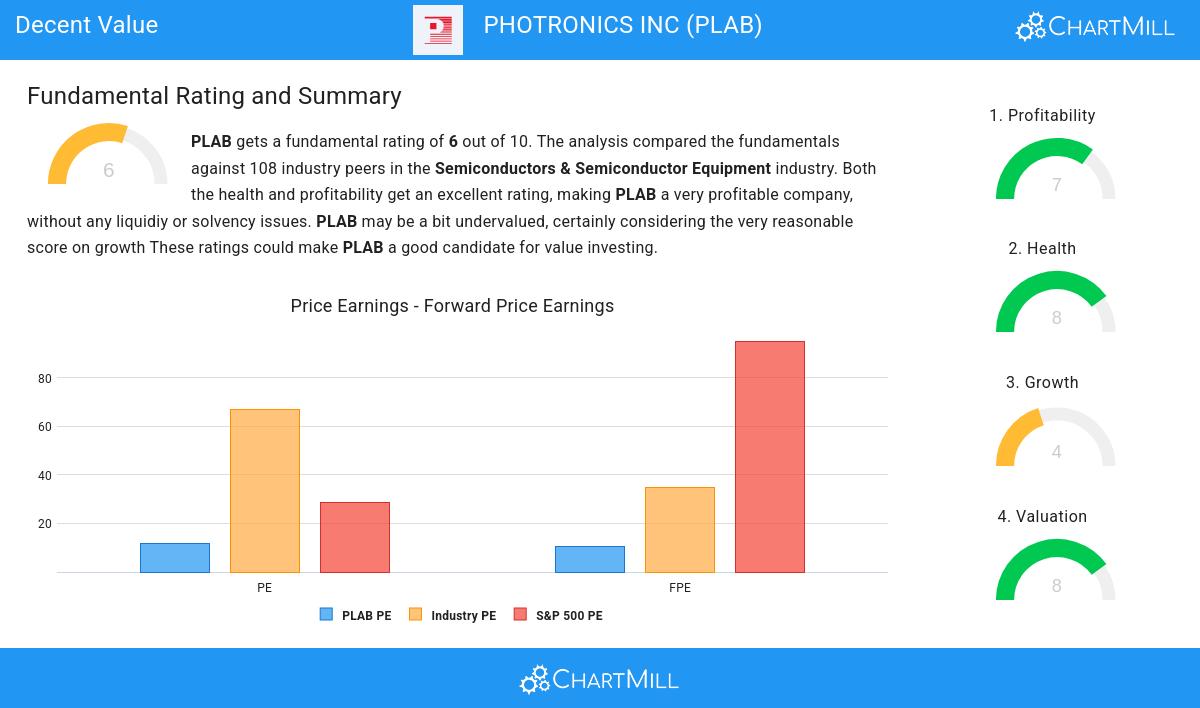
- A Price/Earnings ratio of 11.54 indicates a reasonable valuation of PLAB.
- 95.37% of the companies in the same industry are more expensive than PLAB, based on the Price/Earnings ratio.
- Compared to an average S&P500 Price/Earnings ratio of 28.58, PLAB is valued rather cheaply.
- Based on the Price/Forward Earnings ratio of 10.67, the valuation of PLAB can be described as reasonable.
- 95.37% of the companies in the same industry are more expensive than PLAB, based on the Price/Forward Earnings ratio.
- PLAB's Price/Forward Earnings ratio indicates a rather cheap valuation when compared to the S&P500 average which is at 95.03.
- Based on the Enterprise Value to EBITDA ratio, PLAB is valued cheaper than 98.15% of the companies in the same industry.
- 98.15% of the companies in the same industry are more expensive than PLAB, based on the Price/Free Cash Flow ratio.
- PLAB has a very decent profitability rating, which may justify a higher PE ratio.
Looking at the Profitability
ChartMill assigns a proprietary Profitability Rating to each stock. The score is computed by evaluating various profitability ratios and margins and ranges from 0 to 10. NASDAQ:PLAB was assigned a score of 7 for profitability:
- With a decent Return On Assets value of 7.63%, PLAB is doing good in the industry, outperforming 71.30% of the companies in the same industry.
- The Return On Equity of PLAB (11.66%) is better than 71.30% of its industry peers.
- PLAB's Return On Invested Capital of 10.75% is fine compared to the rest of the industry. PLAB outperforms 79.63% of its industry peers.
- PLAB's Profit Margin of 15.07% is fine compared to the rest of the industry. PLAB outperforms 71.30% of its industry peers.
- PLAB's Profit Margin has improved in the last couple of years.
- PLAB has a better Operating Margin (25.55%) than 85.19% of its industry peers.
- In the last couple of years the Operating Margin of PLAB has grown nicely.
- In the last couple of years the Gross Margin of PLAB has grown nicely.
Evaluating Health: NASDAQ:PLAB
Every stock is evaluated by ChartMill, receiving a Health Rating on a scale of 0 to 10. This assessment considers different health aspects, including liquidity and solvency, both in absolute terms and relative to industry peers. NASDAQ:PLAB has achieved a 8 out of 10:
- PLAB has an Altman-Z score of 3.49. This indicates that PLAB is financially healthy and has little risk of bankruptcy at the moment.
- The Debt to FCF ratio of PLAB is 0.14, which is an excellent value as it means it would take PLAB, only 0.14 years of fcf income to pay off all of its debts.
- PLAB has a better Debt to FCF ratio (0.14) than 86.11% of its industry peers.
- A Debt/Equity ratio of 0.00 indicates that PLAB is not too dependend on debt financing.
- With a decent Debt to Equity ratio value of 0.00, PLAB is doing good in the industry, outperforming 69.44% of the companies in the same industry.
- A Current Ratio of 5.07 indicates that PLAB has no problem at all paying its short term obligations.
- With a decent Current ratio value of 5.07, PLAB is doing good in the industry, outperforming 77.78% of the companies in the same industry.
- PLAB has a Quick Ratio of 4.76. This indicates that PLAB is financially healthy and has no problem in meeting its short term obligations.
- PLAB has a better Quick ratio (4.76) than 83.33% of its industry peers.
Growth Analysis for NASDAQ:PLAB
A key component of ChartMill's stock assessment is the Growth Rating, which spans from 0 to 10. This rating evaluates diverse growth factors, such as EPS and revenue growth, considering both past performance and future projections. NASDAQ:PLAB has received a 4 out of 10:
- Measured over the past years, PLAB shows a very strong growth in Earnings Per Share. The EPS has been growing by 33.90% on average per year.
- PLAB shows quite a strong growth in Revenue. Measured over the last years, the Revenue has been growing by 9.50% yearly.
- The Earnings Per Share is expected to grow by 8.85% on average over the next years. This is quite good.
More Decent Value stocks can be found in our Decent Value screener.
Our latest full fundamental report of PLAB contains the most current fundamental analsysis.
Disclaimer
This article should in no way be interpreted as advice. The article is based on the observed metrics at the time of writing, but you should always make your own analysis and trade or invest at your own responsibility.
PHOTRONICS INC
NASDAQ:PLAB (2/6/2025, 8:08:29 PM)
Premarket: 23.01 +0.12 (+0.52%)22.89
+0.04 (+0.18%)
PLAB Latest News and Analysis
 a day ago - ChartmillNASDAQ:PLAB, an undervalued stock with good fundamentals.
Discover PHOTRONICS INC, an undervalued stock. NASDAQ:PLAB showcases solid financial health and profitability while maintaining an appealing valuation.
