
Investors should take notice of NYSE:PHM—it offers a great deal for the fundamentals it presents.
By Mill Chart
Last update: Sep 18, 2024
Consider PULTEGROUP INC (NYSE:PHM) as a top value stock, identified by our stock screening tool. NYSE:PHM shines in terms of profitability, solvency, and liquidity, all while remaining very reasonably priced. Let's dive deeper into the analysis.
Analyzing Valuation Metrics
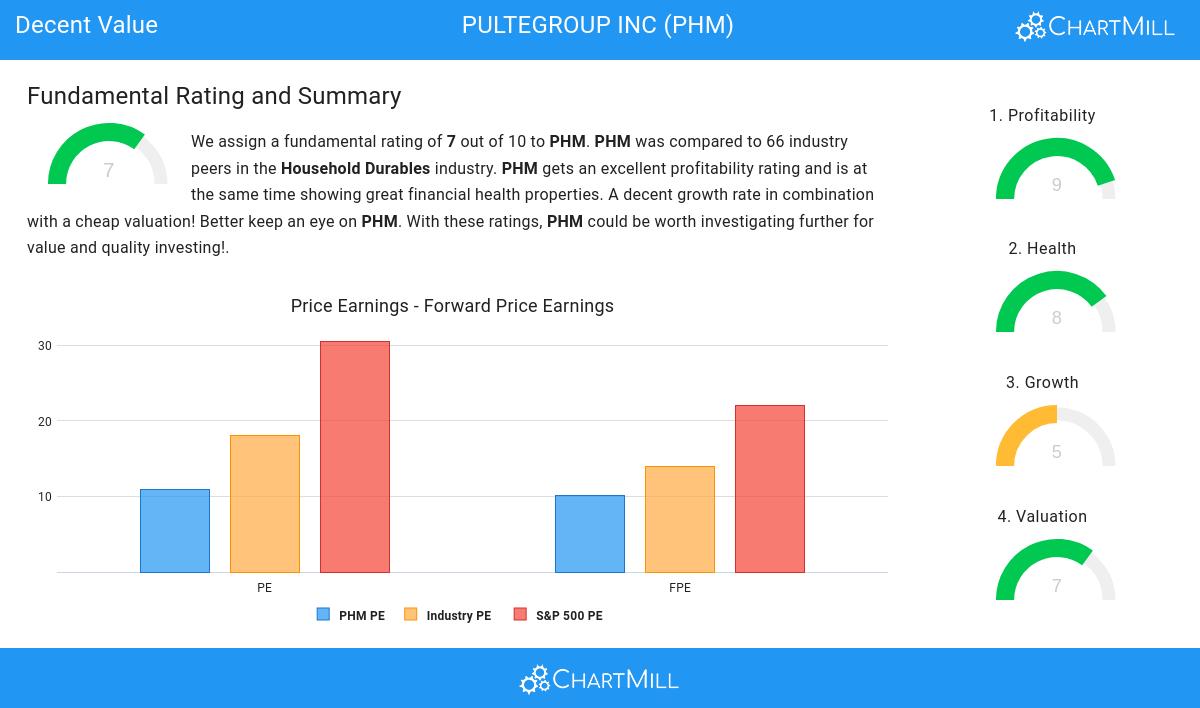
ChartMill employs its own Valuation Rating system for all stocks. This score, ranging from 0 to 10, is determined by evaluating different valuation factors, including price to earnings and free cash flow, both in absolute terms and relative to the market and industry. NYSE:PHM has earned a 7 for valuation:
- Based on the Price/Earnings ratio of 10.87, the valuation of PHM can be described as reasonable.
- 73.44% of the companies in the same industry are more expensive than PHM, based on the Price/Earnings ratio.
- PHM is valuated cheaply when we compare the Price/Earnings ratio to 30.57, which is the current average of the S&P500 Index.
- PHM is valuated reasonably with a Price/Forward Earnings ratio of 10.17.
- PHM's Price/Forward Earnings ratio is a bit cheaper when compared to the industry. PHM is cheaper than 75.00% of the companies in the same industry.
- Compared to an average S&P500 Price/Forward Earnings ratio of 22.04, PHM is valued rather cheaply.
- Compared to the rest of the industry, the Enterprise Value to EBITDA ratio of PHM indicates a somewhat cheap valuation: PHM is cheaper than 78.13% of the companies listed in the same industry.
- The low PEG Ratio(NY), which compensates the Price/Earnings for growth, indicates a rather cheap valuation of the company.
- PHM has an outstanding profitability rating, which may justify a higher PE ratio.
Analyzing Profitability Metrics
ChartMill assigns a proprietary Profitability Rating to each stock. The score is computed by evaluating various profitability ratios and margins and ranges from 0 to 10. NYSE:PHM was assigned a score of 9 for profitability:
- The Return On Assets of PHM (17.03%) is better than 96.88% of its industry peers.
- With an excellent Return On Equity value of 25.10%, PHM belongs to the best of the industry, outperforming 85.94% of the companies in the same industry.
- PHM's Return On Invested Capital of 19.91% is amongst the best of the industry. PHM outperforms 96.88% of its industry peers.
- The Average Return On Invested Capital over the past 3 years for PHM is significantly above the industry average of 10.76%.
- The last Return On Invested Capital (19.91%) for PHM is above the 3 year average (18.34%), which is a sign of increasing profitability.
- Looking at the Profit Margin, with a value of 16.72%, PHM belongs to the top of the industry, outperforming 93.75% of the companies in the same industry.
- In the last couple of years the Profit Margin of PHM has grown nicely.
- PHM has a Operating Margin of 21.49%. This is amongst the best in the industry. PHM outperforms 95.31% of its industry peers.
- In the last couple of years the Operating Margin of PHM has grown nicely.
- In the last couple of years the Gross Margin of PHM has grown nicely.
Health Assessment of NYSE:PHM
To gauge a stock's financial health, ChartMill utilizes a Health Rating on a scale of 0 to 10. This comprehensive evaluation encompasses liquidity and solvency, both in absolute terms and in comparison to industry peers. NYSE:PHM has earned a 8 out of 10:
- PHM has an Altman-Z score of 6.44. This indicates that PHM is financially healthy and has little risk of bankruptcy at the moment.
- PHM has a better Altman-Z score (6.44) than 85.94% of its industry peers.
- The Debt to FCF ratio of PHM is 1.67, which is an excellent value as it means it would take PHM, only 1.67 years of fcf income to pay off all of its debts.
- With a decent Debt to FCF ratio value of 1.67, PHM is doing good in the industry, outperforming 73.44% of the companies in the same industry.
- A Debt/Equity ratio of 0.19 indicates that PHM is not too dependend on debt financing.
- PHM has a better Debt to Equity ratio (0.19) than 68.75% of its industry peers.
- PHM has a Current Ratio of 4.16. This indicates that PHM is financially healthy and has no problem in meeting its short term obligations.
- The Current ratio of PHM (4.16) is better than 70.31% of its industry peers.
- PHM does not score too well on the current and quick ratio evaluation. However, as it has excellent solvency and profitability, these ratios do not necessarly indicate liquidity issues and need to be evaluated against the specifics of the business.
Growth Analysis for NYSE:PHM
To evaluate a stock's growth potential, ChartMill utilizes a Growth Rating on a scale of 0 to 10. This comprehensive assessment considers various growth aspects, including historical and estimated EPS and revenue growth. NYSE:PHM has achieved a 5 out of 10:
- PHM shows a strong growth in Earnings Per Share. In the last year, the EPS has been growing by 10.71%, which is quite good.
- PHM shows a strong growth in Earnings Per Share. Measured over the last years, the EPS has been growing by 25.08% yearly.
- The Revenue has been growing by 9.53% on average over the past years. This is quite good.
- The Earnings Per Share is expected to grow by 8.43% on average over the next years. This is quite good.
More Decent Value stocks can be found in our Decent Value screener.
Our latest full fundamental report of PHM contains the most current fundamental analsysis.
Keep in mind
Important Note: The content of this article is not intended as trading advice. It is essential to perform your own analysis and exercise caution when making trading decisions. The article presents observations created by automated analysis but does not guarantee any trading or investment outcomes. Always trade responsibly and make independent judgments.