
Is PROGRESSIVE CORP (NYSE:PGR) a Minervini-style stock?
By Mill Chart
Last update: Mar 24, 2025
Our stock screener has spotted PROGRESSIVE CORP (NYSE:PGR) as a stocks which checks several boxes as specified by Mark Minervini. We will dive into an analysis below.
Checking the Minervini Trend Template.
The Minervini Trend Template is a set of technical criteria designed to identify stocks in strong uptrends. We can check all the boxes for PGR:
- ✔ Relative Strength is above 70.
- ✔ Current price is within 25% of it's 52-week high.
- ✔ Current price is at least 30% above it's 52-week low.
- ✔ The current price is above the 50-, 150- and 200-day SMA price line.
- ✔ The SMA(200) is trending upwards.
- ✔ The SMA(150) is above the SMA(200)
- ✔ The SMA(50) is above the SMA(150) and the SMA(200)
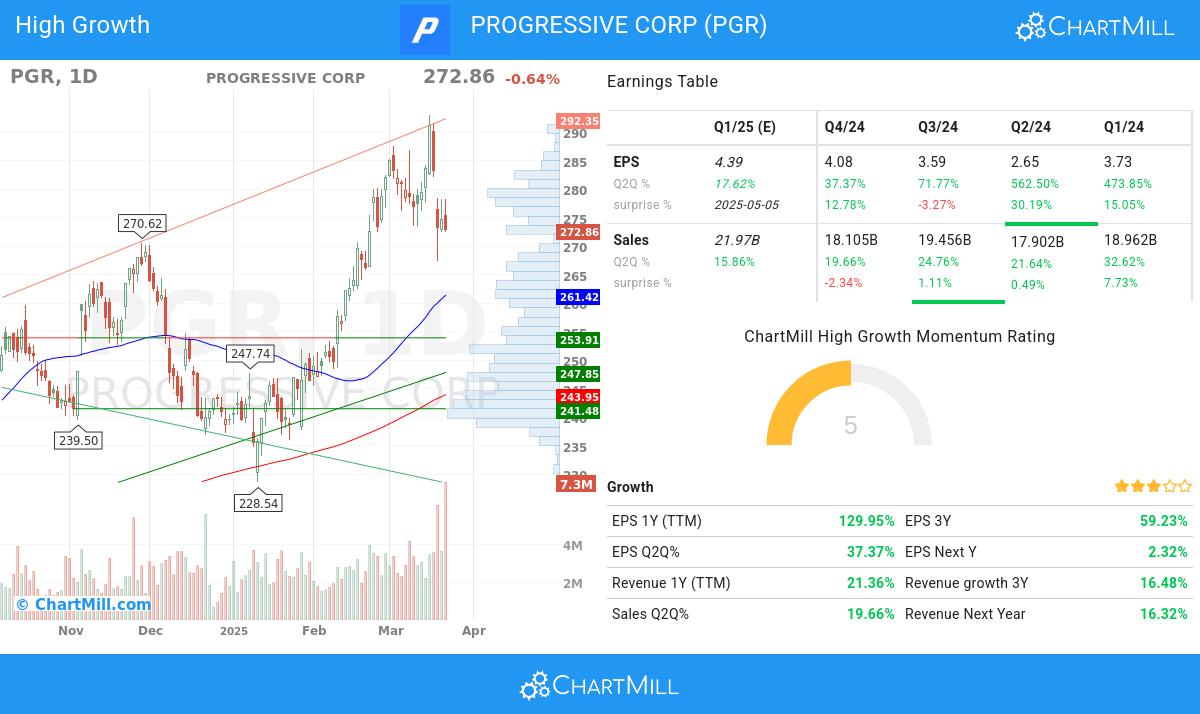
Growth Examination for PGR
To evaluate a stock's growth potential, ChartMill utilizes a High Growth Momentum Rating (HGM) on a scale of 0 to 10. This assessment considers various growth and profitability aspects, like EPS and revenue growth, accelleration, surprises and revisions. PGR has achieved a 5 out of 10:
Earnings Momentum
- The quarterly earnings of PGR have shown a 37.37% increase compared to the previous quarter, as revealed in the recent financial report. This growth signifies positive momentum in the company's financials, pointing towards a promising upward trend
- PGR has experienced 130.0% growth in EPS over a 12 month period, demonstrating its ability to generate sustained and positive earnings momentum.
- PGR has experienced 59.23% growth in EPS over a 3-year period, demonstrating its ability to generate sustained and positive earnings momentum.
- PGR has demonstrated strong quarter-to-quarter (Q2Q) revenue growth of 19.66%, reflecting its ability to generate consistent increases in sales. This growth highlights the company's effective market positioning and its potential for continued success.
- The 1-year revenue growth of PGR (21.36%) has been strong, reflecting the company's ability to generate consistent sales growth. This growth suggests the company's ability to meet customer needs and expand its market share.
- The average next Quarter EPS Estimate by analysts was adjusted by 13.22%, reflecting the evolving market expectations for the company's EPS growth.
- PGR has surpassed EPS estimates 3 times in the last 4 quarters, reflecting its strong financial performance and effective management. This trend suggests the company's ability to generate positive earnings surprises and drive shareholder value.
Profitability & Financial Strength
- The operating margin of PGR has seen steady growth over the past year, signaling improved profitability. This trend indicates the company's effective cost management and its ability to generate higher returns.
- With positive growth in its profit margin over the past year, PGR showcases its ability to improve profitability.
- With a favorable trend in its free cash flow (FCF) over the past year, PGR demonstrates its ability to generate robust cash flows and maintain financial stability. This growth reflects the company's focus on efficient capital allocation and cash management.
- PGR has a healthy Return on Equity(ROE) of 33.07%. This demonstrates the company's efficient utilization of capital and indicates its commitment to driving profitability.
- With a Debt/Equity ratio of 0.27, PGR demonstrates prudent financial management.
Market Strength & Institutional Confidence
- The ownership composition of PGR reflects a balanced investor ecosystem, with institutional shareholders owning 87.34%. This indicates a broader market participation and potential for increased trading liquidity.
- The Relative Strength (RS) of PGR has consistently been strong, with a current 91.15 rating. This indicates the stock's ability to exhibit relative price outperformance and reflects its competitive strength.
How do we evaluate the setup for PGR?
ChartMill also assign a Setup Rating to every stock. This setup score also ranges from 0 to 10 and determines to which extend the stock is consolidating. This is achieved by evaluating multiple short term technical indicators. PGR currently has a 6 as setup rating:
PGR has an excellent technical rating and also presents a decent setup pattern. Prices have been consolidating lately and the volatility has been reduced. A pullback is taking place, which may present a nice opportunity for an entry.
For an up to date full technical analysis you can check the technical report of PGR
More like this
It looks like PROGRESSIVE CORP meets the Minervini criteria. More high growth momentum breakout stocks can be found in our High Growth Momentum + Trend Template screen.
Disclaimer
This article should in no way be interpreted as advice. The article is based on the observed metrics at the time of writing, but you should always make your own analysis and trade or invest at your own responsibility.
NYSE:PGR (4/17/2025, 2:43:08 PM)
268.27
-6.86 (-2.49%)
Find more stocks in the Stock Screener
PGR Latest News and Analysis
 9 days ago - ChartmillTuesday's session: top gainers and losers in the S&P500 index
Curious about the top performers within the S&P500 index one hour before the close of the markets on Tuesday? Dive into the list of today's session's top gainers and losers for a comprehensive overview.
15 days ago - ChartmillWednesday's session: top gainers and losers in the S&P500 indexStay updated with the movements of the S&P500 index in the middle of the day on Wednesday. Discover which stocks are leading as top gainers and losers in today's session.
 15 days ago - ChartmillWhat's going on in today's session: S&P500 gap up and gap down stocks
Wondering what's happening in today's session regarding gap up and gap down stocks? Explore the S&P500 index on Wednesday to uncover the stocks that are gapping in the S&P500 index.
