
Why NYSE:PEN Is a Standout High-Growth Stock in a Consolidation Phase.
By Mill Chart
Last update: Sep 23, 2024
Exploring Growth Potential: PENUMBRA INC (NYSE:PEN) and Its Base Formation. Growth investors seek promising revenue and EPS growth, and PENUMBRA INC has come under our scrutiny for potential growth investing. While it's crucial to do your own research, we've detected PENUMBRA INC on our screen for growth with base formation, suggesting it merits a closer look.
Assessing Growth Metrics for NYSE:PEN
To evaluate a stock's growth potential, ChartMill utilizes a Growth Rating on a scale of 0 to 10. This comprehensive assessment considers various growth aspects, including historical and estimated EPS and revenue growth. NYSE:PEN has achieved a 8 out of 10:
- The Earnings Per Share has grown by an impressive 198.80% over the past year.
- The Earnings Per Share has been growing by 32.59% on average over the past years. This is a very strong growth
- Looking at the last year, PEN shows a very strong growth in Revenue. The Revenue has grown by 20.88%.
- PEN shows quite a strong growth in Revenue. Measured over the last years, the Revenue has been growing by 18.93% yearly.
- The Earnings Per Share is expected to grow by 31.45% on average over the next years. This is a very strong growth
- PEN is expected to show quite a strong growth in Revenue. In the coming years, the Revenue will grow by 15.70% yearly.
Understanding NYSE:PEN's Health Score
ChartMill utilizes a Health Rating to assess stocks, scoring them on a scale of 0 to 10. This rating takes into account a variety of liquidity and solvency ratios, both in absolute terms and in comparison to industry peers. NYSE:PEN has earned a 8 out of 10:
- An Altman-Z score of 13.84 indicates that PEN is not in any danger for bankruptcy at the moment.
- With an excellent Altman-Z score value of 13.84, PEN belongs to the best of the industry, outperforming 90.37% of the companies in the same industry.
- The Debt to FCF ratio of PEN is 0.22, which is an excellent value as it means it would take PEN, only 0.22 years of fcf income to pay off all of its debts.
- With an excellent Debt to FCF ratio value of 0.22, PEN belongs to the best of the industry, outperforming 93.05% of the companies in the same industry.
- PEN has a Debt/Equity ratio of 0.02. This is a healthy value indicating a solid balance between debt and equity.
- The Debt to Equity ratio of PEN (0.02) is better than 65.24% of its industry peers.
- PEN has a Current Ratio of 6.25. This indicates that PEN is financially healthy and has no problem in meeting its short term obligations.
- PEN has a Current ratio of 6.25. This is in the better half of the industry: PEN outperforms 78.61% of its industry peers.
- A Quick Ratio of 3.77 indicates that PEN has no problem at all paying its short term obligations.
- PEN's Quick ratio of 3.77 is fine compared to the rest of the industry. PEN outperforms 68.45% of its industry peers.
How do we evaluate the Profitability for NYSE:PEN?
ChartMill employs its own Profitability Rating system for stock evaluation. This score, ranging from 0 to 10, is derived from an analysis of diverse profitability metrics and margins. In the case of NYSE:PEN, the assigned 6 is noteworthy for profitability:
- Looking at the Return On Assets, with a value of 0.93%, PEN is in the better half of the industry, outperforming 74.33% of the companies in the same industry.
- The Return On Equity of PEN (1.22%) is better than 73.80% of its industry peers.
- The Return On Invested Capital of PEN (6.13%) is better than 81.82% of its industry peers.
- The 3 year average ROIC (2.28%) for PEN is below the current ROIC(6.13%), indicating increased profibility in the last year.
- With a decent Profit Margin value of 1.25%, PEN is doing good in the industry, outperforming 73.26% of the companies in the same industry.
- In the last couple of years the Profit Margin of PEN has grown nicely.
- PEN has a better Operating Margin (9.46%) than 78.61% of its industry peers.
- In the last couple of years the Operating Margin of PEN has grown nicely.
- PEN has a better Gross Margin (65.45%) than 67.38% of its industry peers.
How does the Setup look for NYSE:PEN
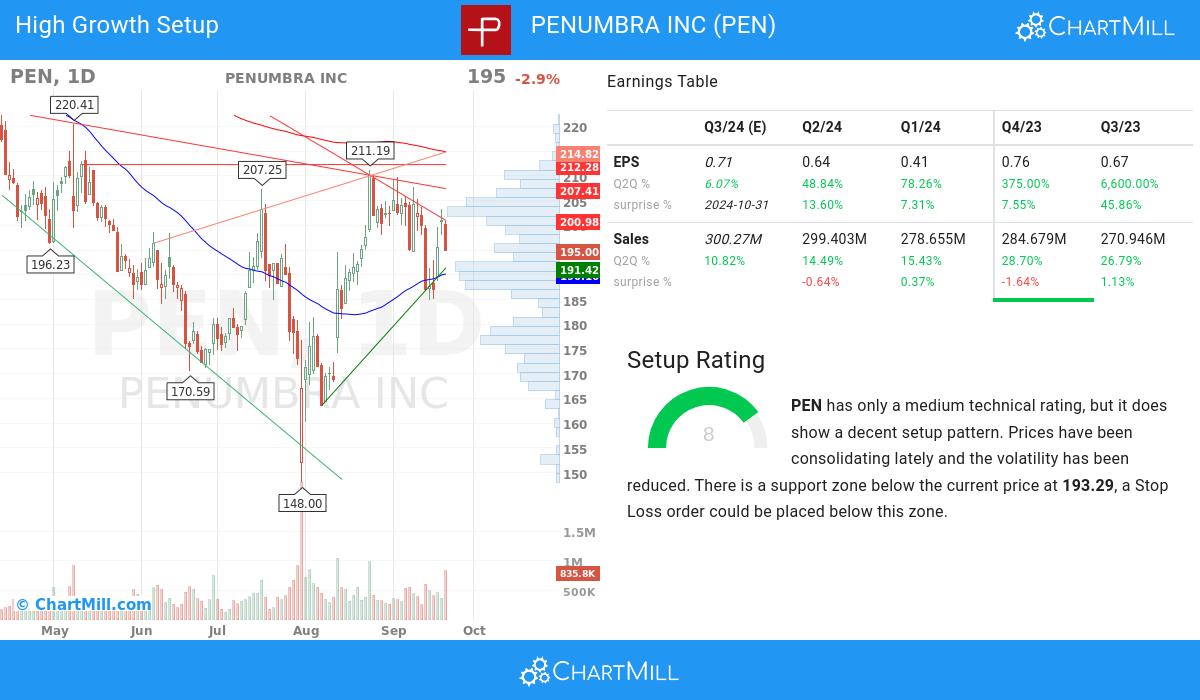
In addition to the Technical Rating, ChartMill provides a Setup Rating for each stock. This rating, ranging from 0 to 10, assesses the extent of consolidation in the stock based on multiple short-term technical indicators. Currently, NYSE:PEN has a 8 as its setup rating:
PEN has only a medium technical rating, but it does show a decent setup pattern. Prices have been consolidating lately and the volatility has been reduced. There is a support zone below the current price at 193.29, a Stop Loss order could be placed below this zone.
Every day, new Strong Growth stocks can be found on ChartMill in our Strong Growth screener.
Our latest full fundamental report of PEN contains the most current fundamental analsysis.
Check the latest full technical report of PEN for a complete technical analysis.
Keep in mind
Important Note: The content of this article is not intended as trading advice. It is essential to perform your own analysis and exercise caution when making trading decisions. The article presents observations created by automated analysis but does not guarantee any trading or investment outcomes. Always trade responsibly and make independent judgments.