
NASDAQ:PDD is showing good growth, while it is not too expensive.
By Mill Chart
Last update: Oct 18, 2024
Our stock screener has spotted PDD HOLDINGS INC (NASDAQ:PDD) as a growth stock which is not overvalued. NASDAQ:PDD is scoring great on several growth aspects while it also shows decent health and profitability. At the same time it remains remains attractively priced. We'll dive into each aspect below.
What does the Growth looks like for NASDAQ:PDD
ChartMill assigns a Growth Rating to every stock. This score ranges from 0 to 10 and evaluates the different growth aspects like EPS and Revenue, both in the past as in the future. NASDAQ:PDD scores a 8 out of 10:
- The Earnings Per Share has grown by an impressive 112.20% over the past year.
- The Revenue has grown by 106.72% in the past year. This is a very strong growth!
- The Revenue has been growing by 79.96% on average over the past years. This is a very strong growth!
- PDD is expected to show a strong growth in Earnings Per Share. In the coming years, the EPS will grow by 30.86% yearly.
- Based on estimates for the next years, PDD will show a very strong growth in Revenue. The Revenue will grow by 26.32% on average per year.
A Closer Look at Valuation for NASDAQ:PDD
ChartMill assigns a Valuation Rating to each stock, ranging from 0 to 10. This rating is calculated by analyzing different valuation elements, such as price to earnings and free cash flow, both in absolute terms and relative to the market and industry. In the case of NASDAQ:PDD, the assigned 8 reflects its valuation:
- Based on the Price/Earnings ratio, PDD is valued a bit cheaper than 65.63% of the companies in the same industry.
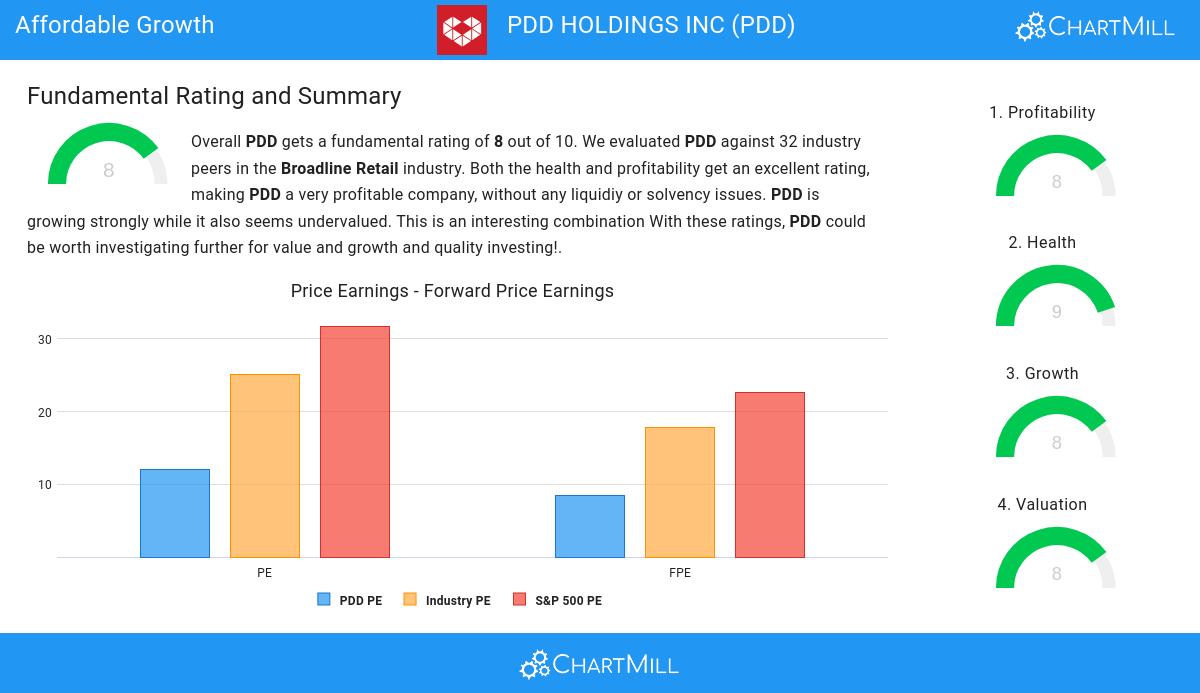
- The average S&P500 Price/Earnings ratio is at 31.77. PDD is valued rather cheaply when compared to this.
- The Price/Forward Earnings ratio is 8.49, which indicates a very decent valuation of PDD.
- PDD's Price/Forward Earnings ratio is rather cheap when compared to the industry. PDD is cheaper than 84.38% of the companies in the same industry.
- The average S&P500 Price/Forward Earnings ratio is at 22.70. PDD is valued rather cheaply when compared to this.
- Based on the Enterprise Value to EBITDA ratio, PDD is valued a bit cheaper than the industry average as 71.88% of the companies are valued more expensively.
- Based on the Price/Free Cash Flow ratio, PDD is valued a bit cheaper than the industry average as 78.13% of the companies are valued more expensively.
- PDD's low PEG Ratio(NY), which compensates the Price/Earnings for growth, indicates a rather cheap valuation of the company.
- PDD has an outstanding profitability rating, which may justify a higher PE ratio.
- PDD's earnings are expected to grow with 38.66% in the coming years. This may justify a more expensive valuation.
Unpacking NASDAQ:PDD's Health Rating
ChartMill assigns a proprietary Health Rating to each stock. The score is computed by evaluating various liquidity and solvency ratios and ranges from 0 to 10. NASDAQ:PDD was assigned a score of 9 for health:
- PDD has an Altman-Z score of 6.60. This indicates that PDD is financially healthy and has little risk of bankruptcy at the moment.
- The Altman-Z score of PDD (6.60) is better than 87.50% of its industry peers.
- PDD has a debt to FCF ratio of 0.04. This is a very positive value and a sign of high solvency as it would only need 0.04 years to pay back of all of its debts.
- PDD has a better Debt to FCF ratio (0.04) than 93.75% of its industry peers.
- A Debt/Equity ratio of 0.02 indicates that PDD is not too dependend on debt financing.
- PDD has a better Debt to Equity ratio (0.02) than 78.13% of its industry peers.
- PDD has a Current Ratio of 2.11. This indicates that PDD is financially healthy and has no problem in meeting its short term obligations.
- Looking at the Current ratio, with a value of 2.11, PDD is in the better half of the industry, outperforming 71.88% of the companies in the same industry.
- PDD has a Quick Ratio of 2.11. This indicates that PDD is financially healthy and has no problem in meeting its short term obligations.
- Looking at the Quick ratio, with a value of 2.11, PDD belongs to the top of the industry, outperforming 81.25% of the companies in the same industry.
Profitability Assessment of NASDAQ:PDD
ChartMill assigns a proprietary Profitability Rating to each stock. The score is computed by evaluating various profitability ratios and margins and ranges from 0 to 10. NASDAQ:PDD was assigned a score of 8 for profitability:
- PDD has a Return On Assets of 22.84%. This is amongst the best in the industry. PDD outperforms 100.00% of its industry peers.
- The Return On Equity of PDD (38.91%) is better than 96.88% of its industry peers.
- PDD's Return On Invested Capital of 31.76% is amongst the best of the industry. PDD outperforms 100.00% of its industry peers.
- Measured over the past 3 years, the Average Return On Invested Capital for PDD is significantly above the industry average of 11.61%.
- The last Return On Invested Capital (31.76%) for PDD is above the 3 year average (17.97%), which is a sign of increasing profitability.
- PDD's Profit Margin of 28.93% is amongst the best of the industry. PDD outperforms 100.00% of its industry peers.
- With an excellent Operating Margin value of 28.57%, PDD belongs to the best of the industry, outperforming 100.00% of the companies in the same industry.
- Looking at the Gross Margin, with a value of 62.44%, PDD belongs to the top of the industry, outperforming 84.38% of the companies in the same industry.
More Affordable Growth stocks can be found in our Affordable Growth screener.
For an up to date full fundamental analysis you can check the fundamental report of PDD
Disclaimer
Important Note: The content of this article is not intended as trading advice. It is essential to perform your own analysis and exercise caution when making trading decisions. The article presents observations created by automated analysis but does not guarantee any trading or investment outcomes. Always trade responsibly and make independent judgments.