ONTO INNOVATION INC (NYSE:ONTO) is showing decent growth, but is still valued reasonably.
By Mill Chart
Last update: Mar 7, 2025
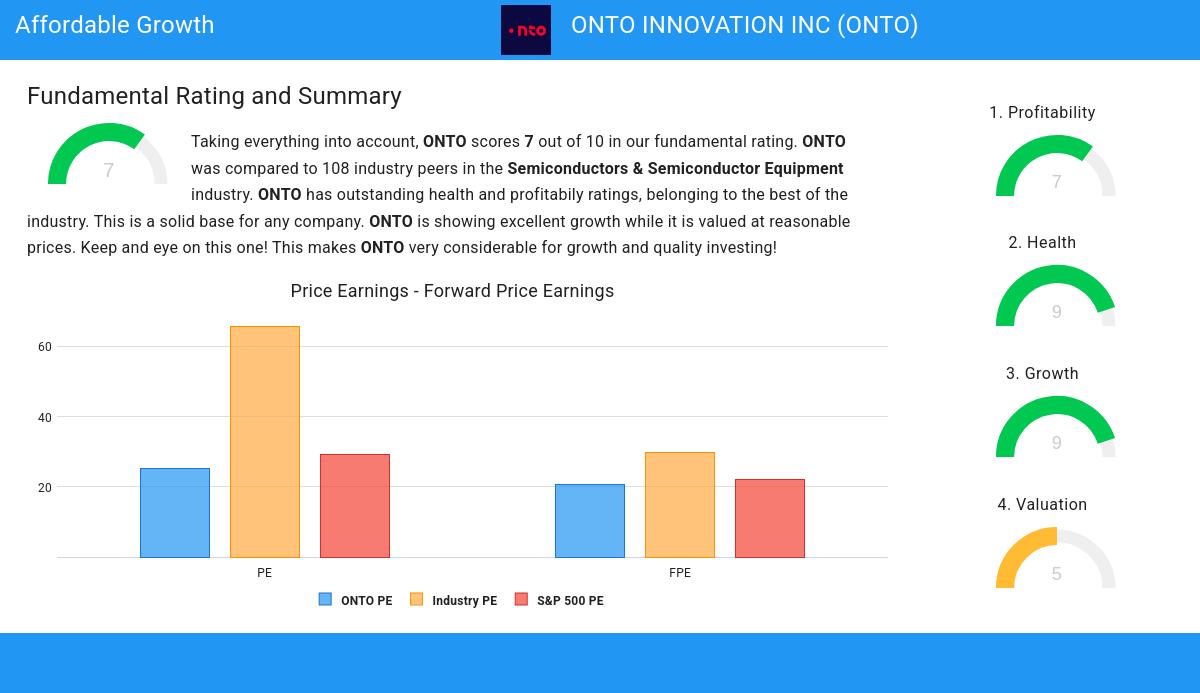
Our stock screener has spotted ONTO INNOVATION INC (NYSE:ONTO) as a growth stock which is not overvalued. NYSE:ONTO is scoring great on several growth aspects while it also shows decent health and profitability. At the same time it remains remains attractively priced. We'll dive into each aspect below.
Growth Assessment of NYSE:ONTO
ChartMill assigns a Growth Rating to every stock. This score ranges from 0 to 10 and evaluates the different growth aspects like EPS and Revenue, both in the past as in the future. NYSE:ONTO scores a 9 out of 10:
- The Earnings Per Share has grown by an impressive 43.43% over the past year.
- ONTO shows a strong growth in Earnings Per Share. Measured over the last years, the EPS has been growing by 36.96% yearly.
- ONTO shows a strong growth in Revenue. In the last year, the Revenue has grown by 21.00%.
- Measured over the past years, ONTO shows a very strong growth in Revenue. The Revenue has been growing by 26.41% on average per year.
- The Earnings Per Share is expected to grow by 22.01% on average over the next years. This is a very strong growth
- ONTO is expected to show quite a strong growth in Revenue. In the coming years, the Revenue will grow by 18.32% yearly.
Valuation Examination for NYSE:ONTO
ChartMill provides a Valuation Rating to every stock, ranging from 0 to 10. This rating assesses various valuation aspects, comparing price to earnings and cash flows, while considering factors like profitability and growth. NYSE:ONTO boasts a 5 out of 10:
- 69.44% of the companies in the same industry are more expensive than ONTO, based on the Price/Earnings ratio.
- Based on the Price/Forward Earnings ratio, ONTO is valued a bit cheaper than 74.07% of the companies in the same industry.
- Based on the Enterprise Value to EBITDA ratio, ONTO is valued a bit cheaper than 65.74% of the companies in the same industry.
- Compared to the rest of the industry, the Price/Free Cash Flow ratio of ONTO indicates a somewhat cheap valuation: ONTO is cheaper than 75.00% of the companies listed in the same industry.
- ONTO has a very decent profitability rating, which may justify a higher PE ratio.
- A more expensive valuation may be justified as ONTO's earnings are expected to grow with 22.10% in the coming years.
Health Insights: NYSE:ONTO
Every stock is evaluated by ChartMill, receiving a Health Rating on a scale of 0 to 10. This assessment considers different health aspects, including liquidity and solvency, both in absolute terms and relative to industry peers. NYSE:ONTO has achieved a 9 out of 10:
- ONTO has an Altman-Z score of 25.35. This indicates that ONTO is financially healthy and has little risk of bankruptcy at the moment.
- With an excellent Altman-Z score value of 25.35, ONTO belongs to the best of the industry, outperforming 90.74% of the companies in the same industry.
- There is no outstanding debt for ONTO. This means it has a Debt/Equity and Debt/FCF ratio of 0 and it is amongst the best of the sector and industry.
- A Current Ratio of 10.07 indicates that ONTO has no problem at all paying its short term obligations.
- With an excellent Current ratio value of 10.07, ONTO belongs to the best of the industry, outperforming 96.30% of the companies in the same industry.
- A Quick Ratio of 7.94 indicates that ONTO has no problem at all paying its short term obligations.
- Looking at the Quick ratio, with a value of 7.94, ONTO belongs to the top of the industry, outperforming 96.30% of the companies in the same industry.
Profitability Assessment of NYSE:ONTO
ChartMill's Profitability Rating offers a unique perspective on stock analysis, providing scores from 0 to 10. These ratings consider a wide range of profitability metrics and margins, both in comparison to industry peers and on their own merits. For NYSE:ONTO, the assigned 7 is a significant indicator of profitability:
- ONTO has a better Return On Assets (8.83%) than 75.00% of its industry peers.
- ONTO's Return On Equity of 9.62% is fine compared to the rest of the industry. ONTO outperforms 68.52% of its industry peers.
- ONTO has a Return On Invested Capital of 8.54%. This is in the better half of the industry: ONTO outperforms 75.93% of its industry peers.
- ONTO has a Profit Margin of 19.44%. This is in the better half of the industry: ONTO outperforms 78.70% of its industry peers.
- ONTO's Profit Margin has improved in the last couple of years.
- ONTO has a Operating Margin of 19.12%. This is in the better half of the industry: ONTO outperforms 75.93% of its industry peers.
- With a decent Gross Margin value of 52.87%, ONTO is doing good in the industry, outperforming 69.44% of the companies in the same industry.
- In the last couple of years the Gross Margin of ONTO has grown nicely.
Every day, new Affordable Growth stocks can be found on ChartMill in our Affordable Growth screener.
Our latest full fundamental report of ONTO contains the most current fundamental analsysis.
Keep in mind
This is not investing advice! The article highlights some of the observations at the time of writing, but you should always make your own analysis and invest based on your own insights.
132.82
-1.43 (-1.07%)
Find more stocks in the Stock Screener
ONTO Latest News and Analysis
 2 days ago - ChartmillONTO INNOVATION INC (NYSE:ONTO) is showing decent growth, but is still valued reasonably.
NYSE:ONTO is scoring great on several growth aspects while it also shows decent health and profitability. At the same time it remains remains attractively priced.
