In a market where value is scarce, ON SEMICONDUCTOR (NASDAQ:ON) offers a refreshing opportunity with its solid fundamentals.
By Mill Chart
Last update: Mar 5, 2025
Our stock screening tool has pinpointed ON SEMICONDUCTOR (NASDAQ:ON) as an undervalued stock option. NASDAQ:ON retains a strong financial foundation and an attractive price tag. Let's delve into the specifics below.
Valuation Assessment of NASDAQ:ON
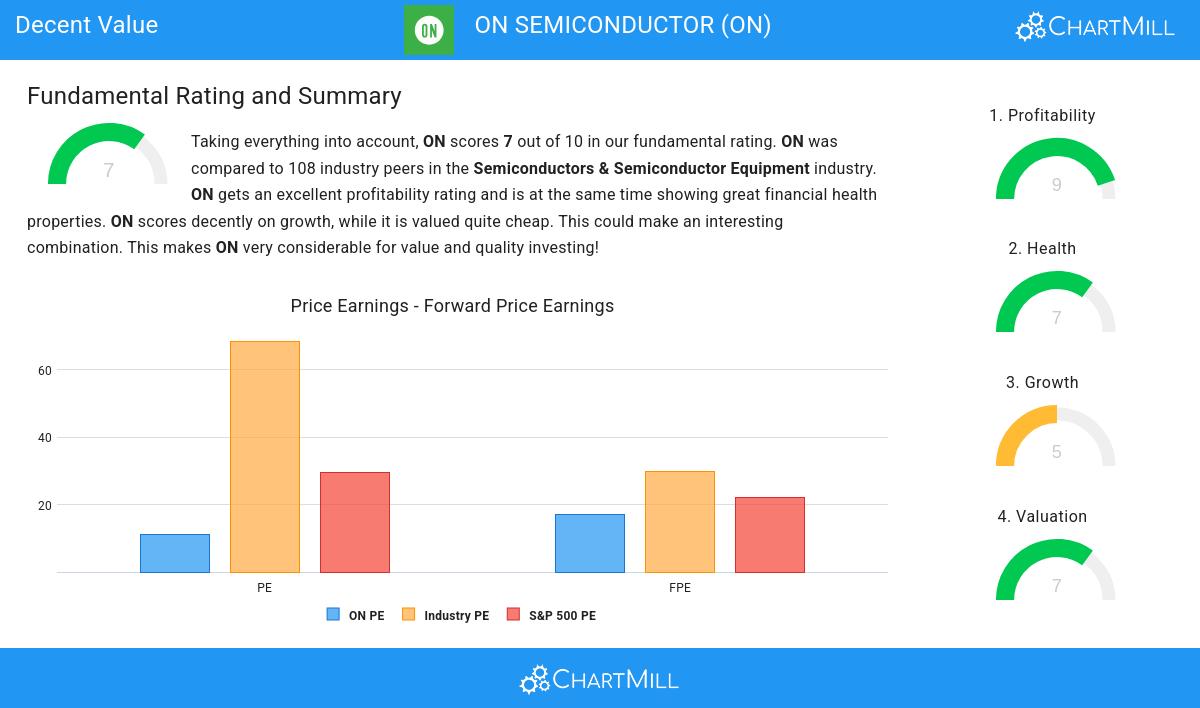
ChartMill assigns a Valuation Rating to every stock. This score ranges from 0 to 10 and evaluates the different valuation aspects and compares the price to earnings and cash flows, while taking into account profitability and growth. NASDAQ:ON scores a 7 out of 10:
- With a Price/Earnings ratio of 11.18, the valuation of ON can be described as very reasonable.
- 92.59% of the companies in the same industry are more expensive than ON, based on the Price/Earnings ratio.
- ON's Price/Earnings ratio indicates a rather cheap valuation when compared to the S&P500 average which is at 29.41.
- Based on the Price/Forward Earnings ratio, ON is valued cheaper than 81.48% of the companies in the same industry.
- ON's Price/Forward Earnings ratio indicates a valuation a bit cheaper than the S&P500 average which is at 22.12.
- ON's Enterprise Value to EBITDA ratio is rather cheap when compared to the industry. ON is cheaper than 90.74% of the companies in the same industry.
- Compared to the rest of the industry, the Price/Free Cash Flow ratio of ON indicates a rather cheap valuation: ON is cheaper than 92.59% of the companies listed in the same industry.
- The excellent profitability rating of ON may justify a higher PE ratio.
Profitability Examination for NASDAQ:ON
ChartMill employs its own Profitability Rating system for stock evaluation. This score, ranging from 0 to 10, is derived from an analysis of diverse profitability metrics and margins. In the case of NASDAQ:ON, the assigned 9 is noteworthy for profitability:
- ON's Return On Assets of 11.16% is fine compared to the rest of the industry. ON outperforms 79.63% of its industry peers.
- Looking at the Return On Equity, with a value of 17.88%, ON belongs to the top of the industry, outperforming 81.48% of the companies in the same industry.
- ON has a better Return On Invested Capital (12.81%) than 84.26% of its industry peers.
- The Average Return On Invested Capital over the past 3 years for ON is significantly above the industry average of 11.47%.
- The last Return On Invested Capital (12.81%) for ON is well below the 3 year average (19.04%), which needs to be investigated, but indicates that ON had better years and this may not be a problem.
- ON has a Profit Margin of 22.21%. This is amongst the best in the industry. ON outperforms 83.33% of its industry peers.
- ON's Profit Margin has improved in the last couple of years.
- Looking at the Operating Margin, with a value of 26.85%, ON belongs to the top of the industry, outperforming 87.04% of the companies in the same industry.
- In the last couple of years the Operating Margin of ON has grown nicely.
- In the last couple of years the Gross Margin of ON has grown nicely.
Health Insights: NASDAQ:ON
ChartMill assigns a proprietary Health Rating to each stock. The score is computed by evaluating various liquidity and solvency ratios and ranges from 0 to 10. NASDAQ:ON was assigned a score of 7 for health:
- An Altman-Z score of 4.34 indicates that ON is not in any danger for bankruptcy at the moment.
- ON has a better Altman-Z score (4.34) than 60.19% of its industry peers.
- The Debt to FCF ratio of ON is 2.78, which is a good value as it means it would take ON, 2.78 years of fcf income to pay off all of its debts.
- ON has a better Debt to FCF ratio (2.78) than 67.59% of its industry peers.
- ON has a Debt/Equity ratio of 0.38. This is a healthy value indicating a solid balance between debt and equity.
- ON has a Current Ratio of 5.06. This indicates that ON is financially healthy and has no problem in meeting its short term obligations.
- Looking at the Current ratio, with a value of 5.06, ON is in the better half of the industry, outperforming 77.78% of the companies in the same industry.
- ON has a Quick Ratio of 3.38. This indicates that ON is financially healthy and has no problem in meeting its short term obligations.
- The Quick ratio of ON (3.38) is better than 68.52% of its industry peers.
Understanding NASDAQ:ON's Growth
ChartMill assigns a Growth Rating to each stock, ranging from 0 to 10. This rating is determined by analyzing different growth elements, including EPS and revenue growth, spanning both historical and future figures. In the case of NASDAQ:ON, the assigned 5 reflects its growth potential:
- Measured over the past years, ON shows a very strong growth in Earnings Per Share. The EPS has been growing by 21.88% on average per year.
- The Earnings Per Share is expected to grow by 23.62% on average over the next years. This is a very strong growth
- Based on estimates for the next years, ON will show a quite strong growth in Revenue. The Revenue will grow by 11.66% on average per year.
- The Revenue growth rate is accelerating: in the next years the growth will be better than in the last years.
More Decent Value stocks can be found in our Decent Value screener.
For an up to date full fundamental analysis you can check the fundamental report of ON
Keep in mind
Important Note: The content of this article is not intended as trading advice. It is essential to perform your own analysis and exercise caution when making trading decisions. The article presents observations created by automated analysis but does not guarantee any trading or investment outcomes. Always trade responsibly and make independent judgments.
NASDAQ:ON (3/7/2025, 11:50:07 AM)
43.66
-0.22 (-0.5%)
Find more stocks in the Stock Screener
ON Latest News and Analysis
 a day ago - ChartmillWhat's going on in today's session: S&P500 movers
Curious about the top performers within the S&P500 index in the middle of the day on Thursday? Dive into the list of today's session's top gainers and losers for a comprehensive overview.
 a day ago - ChartmillThese S&P500 stocks are gapping in today's session
Seeking insights into today's market movers? Discover the S&P500 gap up and gap down stocks in today's session on Thursday. Stay informed about the latest market trends.
 a day ago - ChartmillWhat's going on in today's pre-market session: S&P500 movers
Stay updated with the S&P500 stocks that are on the move in today's pre-market session.
2 days ago - ChartmillWednesday's pre-market session: top gainers and losers in the S&P500 indexThe US market is yet to commence its session on Wednesday, but let's get a preview of the pre-market session and explore the top S&P500 gainers and losers driving the early market movements.
 2 days ago - ChartmillIn a market where value is scarce, ON SEMICONDUCTOR (NASDAQ:ON) offers a refreshing opportunity with its solid fundamentals.
When you look at ON SEMICONDUCTOR (NASDAQ:ON), it's hard to ignore the strong fundamentals, especially considering its likely undervaluation.
16 days ago - ChartmillWhich S&P500 stocks are moving on Wednesday?Let's have a look at what is happening on the US markets one hour before the close of the markets on Wednesday. Below you can find the top S&P500 gainers and losers in today's session.
16 days ago - ChartmillWhat's going on in today's session: S&P500 moversUncover the latest developments among S&P500 stocks in today's session. Stay tuned to the S&P500 index's top gainers and losers on Wednesday.
