Exploring the Growth Potential of NASDAQ:OLED as It Nears a Breakout.
By Mill Chart
Last update: Feb 21, 2025
Exploring Growth Potential: UNIVERSAL DISPLAY CORP (NASDAQ:OLED) and Its Base Formation. Growth investors seek promising revenue and EPS growth, and UNIVERSAL DISPLAY CORP has come under our scrutiny for potential growth investing. While it's crucial to do your own research, we've detected UNIVERSAL DISPLAY CORP on our screen for growth with base formation, suggesting it merits a closer look.
Growth Analysis for NASDAQ:OLED
To evaluate a stock's growth potential, ChartMill utilizes a Growth Rating on a scale of 0 to 10. This comprehensive assessment considers various growth aspects, including historical and estimated EPS and revenue growth. NASDAQ:OLED has achieved a 4 out of 10:
- OLED shows a strong growth in Earnings Per Share. In the last year, the EPS has been growing by 15.80%, which is quite good.
- OLED shows quite a strong growth in Earnings Per Share. Measured over the last years, the EPS has been growing by 10.95% yearly.
- Based on estimates for the next years, OLED will show a quite strong growth in Earnings Per Share. The EPS will grow by 19.25% on average per year.
- The Revenue is expected to grow by 17.10% on average over the next years. This is quite good.
- When comparing the EPS growth rate of the last years to the growth rate of the upcoming years, we see that the growth is accelerating.
Health Assessment of NASDAQ:OLED
A critical element of ChartMill's stock evaluation is the Health Rating, which spans from 0 to 10. This rating considers multiple health factors, including liquidity and solvency, both in absolute terms and relative to industry peers. NASDAQ:OLED has received a 9 out of 10:
- An Altman-Z score of 20.98 indicates that OLED is not in any danger for bankruptcy at the moment.
- The Altman-Z score of OLED (20.98) is better than 87.96% of its industry peers.
- There is no outstanding debt for OLED. This means it has a Debt/Equity and Debt/FCF ratio of 0 and it is amongst the best of the sector and industry.
- OLED has a Current Ratio of 7.18. This indicates that OLED is financially healthy and has no problem in meeting its short term obligations.
- Looking at the Current ratio, with a value of 7.18, OLED belongs to the top of the industry, outperforming 90.74% of the companies in the same industry.
- A Quick Ratio of 5.84 indicates that OLED has no problem at all paying its short term obligations.
- OLED has a better Quick ratio (5.84) than 90.74% of its industry peers.
A Closer Look at Profitability for NASDAQ:OLED
ChartMill assigns a Profitability Rating to every stock. This score ranges from 0 to 10 and evaluates the different profitability ratios and margins, both absolutely, but also relative to the industry peers. NASDAQ:OLED scores a 9 out of 10:
- OLED has a Return On Assets of 16.23%. This is amongst the best in the industry. OLED outperforms 89.81% of its industry peers.
- OLED has a Return On Equity of 18.53%. This is amongst the best in the industry. OLED outperforms 83.33% of its industry peers.
- The Return On Invested Capital of OLED (15.05%) is better than 87.04% of its industry peers.
- The Average Return On Invested Capital over the past 3 years for OLED is above the industry average of 11.67%.
- The last Return On Invested Capital (15.05%) for OLED is above the 3 year average (13.67%), which is a sign of increasing profitability.
- Looking at the Profit Margin, with a value of 36.34%, OLED belongs to the top of the industry, outperforming 95.37% of the companies in the same industry.
- OLED's Profit Margin has improved in the last couple of years.
- With an excellent Operating Margin value of 38.81%, OLED belongs to the best of the industry, outperforming 96.30% of the companies in the same industry.
- In the last couple of years the Operating Margin of OLED has grown nicely.
- OLED has a better Gross Margin (76.77%) than 95.37% of its industry peers.
How do we evaluate the setup for NASDAQ:OLED?
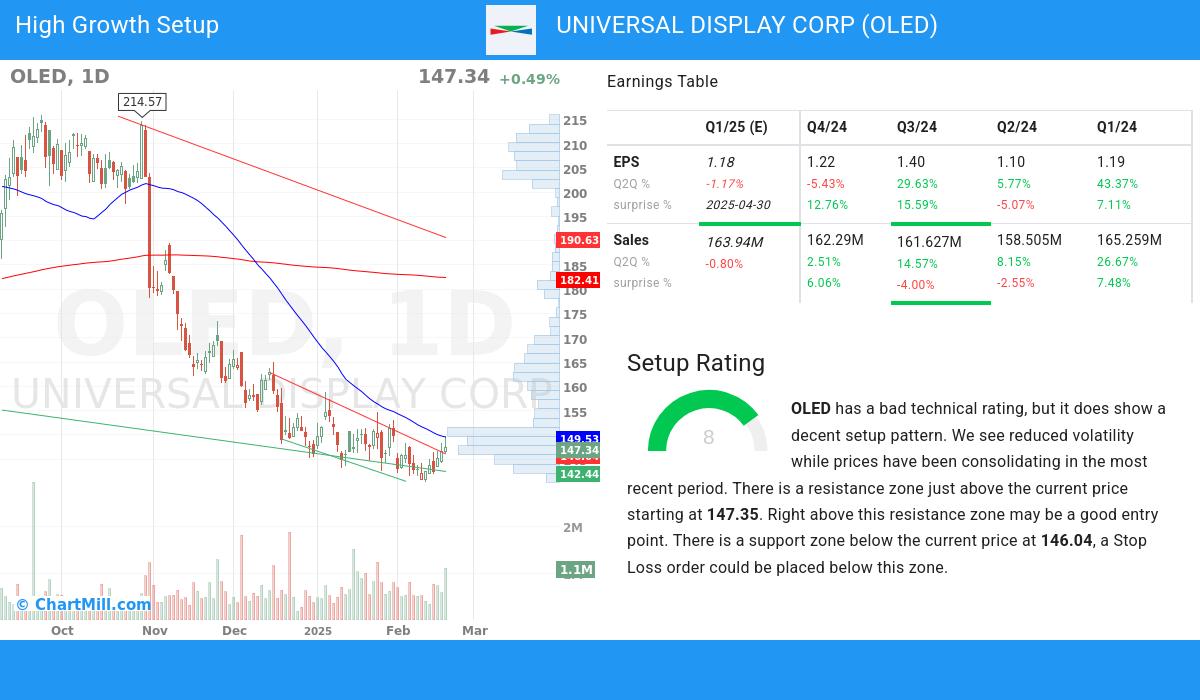
In addition to the Technical Rating, ChartMill provides a Setup Rating for each stock. This rating, ranging from 0 to 10, assesses the extent of consolidation in the stock based on multiple short-term technical indicators. Currently, NASDAQ:OLED has a 8 as its setup rating:
Although the technical rating is bad, OLED does present a nice setup opportunity. We see reduced volatility while prices have been consolidating in the most recent period. There is a resistance zone just above the current price starting at 147.35. Right above this resistance zone may be a good entry point. There is a support zone below the current price at 146.04, a Stop Loss order could be placed below this zone.
More Strong Growth stocks can be found in our Strong Growth screener.
For an up to date full fundamental analysis you can check the fundamental report of OLED
Our latest full technical report of OLED contains the most current technical analsysis.
Disclaimer
This is not investing advice! The article highlights some of the observations at the time of writing, but you should always make your own analysis and invest based on your own insights.
147.34
+0.72 (+0.49%)
Find more stocks in the Stock Screener
OLED Latest News and Analysis
 a minute ago - ChartmillExploring the Growth Potential of NASDAQ:OLED as It Nears a Breakout.
Based on a technical and fundamental analysis of NASDAQ:OLED we can say: UNIVERSAL DISPLAY CORP (NASDAQ:OLED), a strong growth stock, setting up for a breakout.
 9 days ago - ChartmillDespite its growth, NASDAQ:OLED remains within the realm of affordability.
Based on Fundamental Analysis it can be said that NASDAQ:OLED is a growth stock which is not overvalued.
