Despite its growth, NEXTRACKER INC-CL A (NASDAQ:NXT) remains within the realm of affordability.
By Mill Chart
Last update: Apr 30, 2025
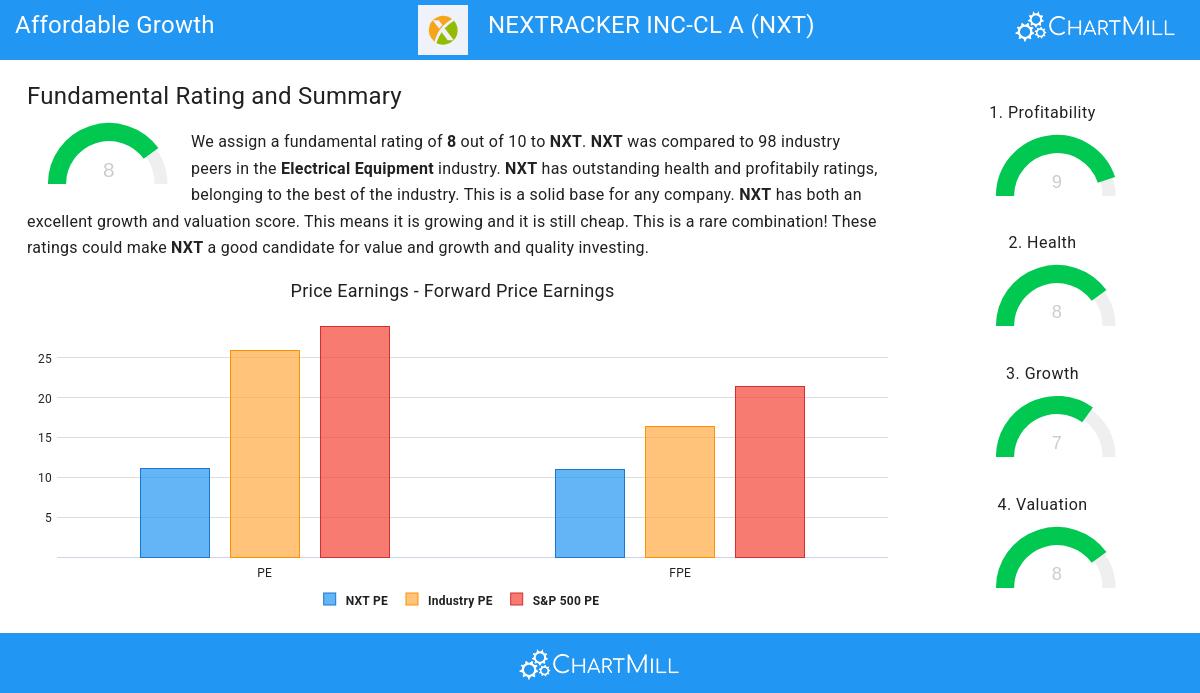
Our stock screener has singled out NEXTRACKER INC-CL A (NASDAQ:NXT) as an attractive growth opportunity. NXT is demonstrating remarkable growth potential while maintaining strong financial indicators, making it a reasonably priced option. We'll explore this further.
Growth Assessment of NXT
ChartMill employs its own Growth Rating system for all stocks. This score, ranging from 0 to 10, is derived by evaluating different growth factors, such as EPS and revenue growth, taking into account both past performance and future projections. NXT has earned a 7 for growth:
- NXT shows a strong growth in Earnings Per Share. In the last year, the EPS has been growing by 57.49%, which is quite impressive.
- Looking at the last year, NXT shows a very strong growth in Revenue. The Revenue has grown by 21.46%.
- The Revenue has been growing by 30.49% on average over the past years. This is a very strong growth!
- The Revenue is expected to grow by 10.91% on average over the next years. This is quite good.
- The EPS growth rate is accelerating: in the next years the growth will be better than in the last years.
Valuation Insights: NXT
To assess a stock's valuation, ChartMill utilizes a Valuation Rating on a scale of 0 to 10. This comprehensive assessment considers various valuation aspects, comparing price to earnings and cash flows, while factoring in profitability and growth. NXT has achieved a 8 out of 10:
- NXT is valuated reasonably with a Price/Earnings ratio of 11.07.
- Based on the Price/Earnings ratio, NXT is valued cheaper than 89.80% of the companies in the same industry.
- The average S&P500 Price/Earnings ratio is at 28.98. NXT is valued rather cheaply when compared to this.
- NXT is valuated reasonably with a Price/Forward Earnings ratio of 11.02.
- Based on the Price/Forward Earnings ratio, NXT is valued cheaper than 89.80% of the companies in the same industry.
- NXT is valuated rather cheaply when we compare the Price/Forward Earnings ratio to 21.38, which is the current average of the S&P500 Index.
- Based on the Enterprise Value to EBITDA ratio, NXT is valued cheaply inside the industry as 90.82% of the companies are valued more expensively.
- Based on the Price/Free Cash Flow ratio, NXT is valued cheaply inside the industry as 86.73% of the companies are valued more expensively.
- NXT's low PEG Ratio(NY), which compensates the Price/Earnings for growth, indicates a rather cheap valuation of the company.
- The excellent profitability rating of NXT may justify a higher PE ratio.
Exploring NXT's Health
To gauge a stock's financial health, ChartMill utilizes a Health Rating on a scale of 0 to 10. This comprehensive evaluation encompasses liquidity and solvency, both in absolute terms and in comparison to industry peers. NXT has earned a 8 out of 10:
- NXT has an Altman-Z score of 3.27. This indicates that NXT is financially healthy and has little risk of bankruptcy at the moment.
- Looking at the Altman-Z score, with a value of 3.27, NXT is in the better half of the industry, outperforming 73.47% of the companies in the same industry.
- NXT has a debt to FCF ratio of 0.29. This is a very positive value and a sign of high solvency as it would only need 0.29 years to pay back of all of its debts.
- Looking at the Debt to FCF ratio, with a value of 0.29, NXT belongs to the top of the industry, outperforming 94.90% of the companies in the same industry.
- A Debt/Equity ratio of 0.10 indicates that NXT is not too dependend on debt financing.
- The Debt to Equity ratio of NXT (0.10) is better than 68.37% of its industry peers.
- NXT has a Current Ratio of 2.20. This indicates that NXT is financially healthy and has no problem in meeting its short term obligations.
- NXT has a Current ratio of 2.20. This is in the better half of the industry: NXT outperforms 65.31% of its industry peers.
- NXT has a Quick ratio of 1.96. This is in the better half of the industry: NXT outperforms 76.53% of its industry peers.
Exploring NXT's Profitability
ChartMill assigns a proprietary Profitability Rating to each stock. The score is computed by evaluating various profitability ratios and margins and ranges from 0 to 10. NXT was assigned a score of 9 for profitability:
- With an excellent Return On Assets value of 18.69%, NXT belongs to the best of the industry, outperforming 98.98% of the companies in the same industry.
- NXT has a better Return On Equity (39.64%) than 98.98% of its industry peers.
- With an excellent Return On Invested Capital value of 26.41%, NXT belongs to the best of the industry, outperforming 97.96% of the companies in the same industry.
- The Average Return On Invested Capital over the past 3 years for NXT is significantly above the industry average of 9.63%.
- The 3 year average ROIC (17.04%) for NXT is below the current ROIC(26.41%), indicating increased profibility in the last year.
- With an excellent Profit Margin value of 20.12%, NXT belongs to the best of the industry, outperforming 100.00% of the companies in the same industry.
- In the last couple of years the Profit Margin of NXT has grown nicely.
- NXT has a Operating Margin of 25.83%. This is amongst the best in the industry. NXT outperforms 98.98% of its industry peers.
- NXT's Operating Margin has improved in the last couple of years.
- NXT's Gross Margin of 37.66% is amongst the best of the industry. NXT outperforms 85.71% of its industry peers.
- In the last couple of years the Gross Margin of NXT has grown nicely.
Every day, new Affordable Growth stocks can be found on ChartMill in our Affordable Growth screener.
For an up to date full fundamental analysis you can check the fundamental report of NXT
Disclaimer
This article should in no way be interpreted as advice. The article is based on the observed metrics at the time of writing, but you should always make your own analysis and trade or invest at your own responsibility.
43.07
-0.13 (-0.3%)
Find more stocks in the Stock Screener
NXT Latest News and Analysis
 4 minutes ago - ChartmillDespite its growth, NEXTRACKER INC-CL A (NASDAQ:NXT) remains within the realm of affordability.
NEXTRACKER INC-CL A could be undervalued. NASDAQ:NXT is scoring impressively in terms of growth while demonstrating strong financials. On top of that, it remains attractively priced.
 2 days ago - ChartmillDespite its impressive fundamentals,NEXTRACKER INC-CL A (NASDAQ:NXT) remains undervalued.
Discover NEXTRACKER INC-CL A, an undervalued stock. NASDAQ:NXT showcases solid financial health and profitability while maintaining an appealing valuation.
