NOVARTIS AG-SPONSORED ADR (NYSE:NVS) is a prime example of a stock that offers more than what meets the eye in terms of fundamentals.
By Mill Chart
Last update: Apr 24, 2025
NOVARTIS AG-SPONSORED ADR (NYSE:NVS) was identified as a decent value stock by our stock screener. NVS scores well on profitability, solvency and liquidity. At the same time it seems to be priced very reasonably. We'll explore this a bit deeper below.
Analyzing Valuation Metrics
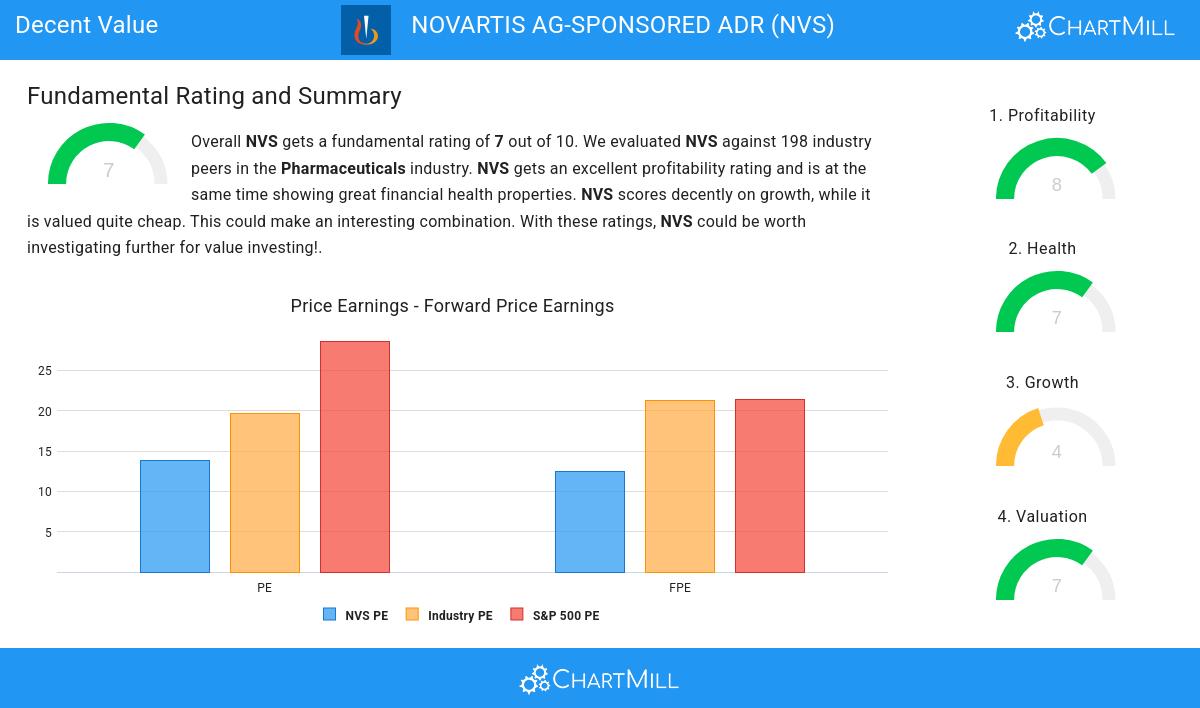
ChartMill assigns a Valuation Rating to every stock. This score ranges from 0 to 10 and evaluates the different valuation aspects and compares the price to earnings and cash flows, while taking into account profitability and growth. NVS scores a 7 out of 10:
- Based on the Price/Earnings ratio, NVS is valued cheaper than 86.87% of the companies in the same industry.
- NVS is valuated cheaply when we compare the Price/Earnings ratio to 28.64, which is the current average of the S&P500 Index.
- Based on the Price/Forward Earnings ratio, NVS is valued cheaply inside the industry as 85.35% of the companies are valued more expensively.
- When comparing the Price/Forward Earnings ratio of NVS to the average of the S&P500 Index (21.44), we can say NVS is valued slightly cheaper.
- Based on the Enterprise Value to EBITDA ratio, NVS is valued cheaply inside the industry as 83.33% of the companies are valued more expensively.
- 86.36% of the companies in the same industry are more expensive than NVS, based on the Price/Free Cash Flow ratio.
- NVS has an outstanding profitability rating, which may justify a higher PE ratio.
Profitability Assessment of NVS
ChartMill assigns a Profitability Rating to every stock. This score ranges from 0 to 10 and evaluates the different profitability ratios and margins, both absolutely, but also relative to the industry peers. NVS scores a 8 out of 10:
- NVS has a better Return On Assets (12.25%) than 94.95% of its industry peers.
- The Return On Equity of NVS (28.61%) is better than 95.96% of its industry peers.
- NVS has a Return On Invested Capital of 21.20%. This is amongst the best in the industry. NVS outperforms 95.45% of its industry peers.
- The 3 year average ROIC (14.58%) for NVS is below the current ROIC(21.20%), indicating increased profibility in the last year.
- NVS has a Profit Margin of 23.09%. This is amongst the best in the industry. NVS outperforms 95.45% of its industry peers.
- NVS has a better Operating Margin (31.57%) than 94.95% of its industry peers.
- In the last couple of years the Operating Margin of NVS has grown nicely.
- NVS has a better Gross Margin (75.22%) than 80.81% of its industry peers.
Exploring NVS's Health
Every stock is evaluated by ChartMill, receiving a Health Rating on a scale of 0 to 10. This assessment considers different health aspects, including liquidity and solvency, both in absolute terms and relative to industry peers. NVS has achieved a 7 out of 10:
- An Altman-Z score of 3.99 indicates that NVS is not in any danger for bankruptcy at the moment.
- NVS's Altman-Z score of 3.99 is amongst the best of the industry. NVS outperforms 80.30% of its industry peers.
- NVS has a debt to FCF ratio of 2.10. This is a good value and a sign of high solvency as NVS would need 2.10 years to pay back of all of its debts.
- NVS's Debt to FCF ratio of 2.10 is amongst the best of the industry. NVS outperforms 92.93% of its industry peers.
- Even though the debt/equity ratio score it not favorable for NVS, it has very limited outstanding debt, so we won't put too much weight on the DE evaluation.
- The current and quick ratio evaluation for NVS is rather negative, while it does have excellent solvency and profitability. These ratios do not necessarly indicate liquidity issues and need to be evaluated against the specifics of the business.
Deciphering NVS's Growth Rating
ChartMill assigns a Growth Rating to every stock. This score ranges from 0 to 10 and evaluates the different growth aspects like EPS and Revenue, both in the past as in the future. NVS scores a 4 out of 10:
- NVS shows a strong growth in Earnings Per Share. In the last year, the EPS has been growing by 13.19%, which is quite good.
- Measured over the past years, NVS shows a quite strong growth in Earnings Per Share. The EPS has been growing by 8.14% on average per year.
- When comparing the Revenue growth rate of the last years to the growth rate of the upcoming years, we see that the growth is accelerating.
Our Decent Value screener lists more Decent Value stocks and is updated daily.
Check the latest full fundamental report of NVS for a complete fundamental analysis.
Disclaimer
This is not investing advice! The article highlights some of the observations at the time of writing, but you should always make your own analysis and invest based on your own insights.
110.13
-1.28 (-1.15%)
Find more stocks in the Stock Screener
NVS Latest News and Analysis
 2 minutes ago - ChartmillNOVARTIS AG-SPONSORED ADR (NYSE:NVS) is a prime example of a stock that offers more than what meets the eye in terms of fundamentals.
NOVARTIS AG-SPONSORED ADR has a stellar value proposition. NYSE:NVS not only scores well in profitability, solvency, and liquidity but also maintains a very reasonable price point.
