NOVARTIS AG-SPONSORED ADR (NYSE:NVS) stands out as a stock that provides good value for the fundamentals it showcases.
By Mill Chart
Last update: Mar 4, 2025
Consider NOVARTIS AG-SPONSORED ADR (NYSE:NVS) as a top value stock, identified by our stock screening tool. NYSE:NVS shines in terms of profitability, solvency, and liquidity, all while remaining very reasonably priced. Let's dive deeper into the analysis.
Understanding NYSE:NVS's Valuation Score
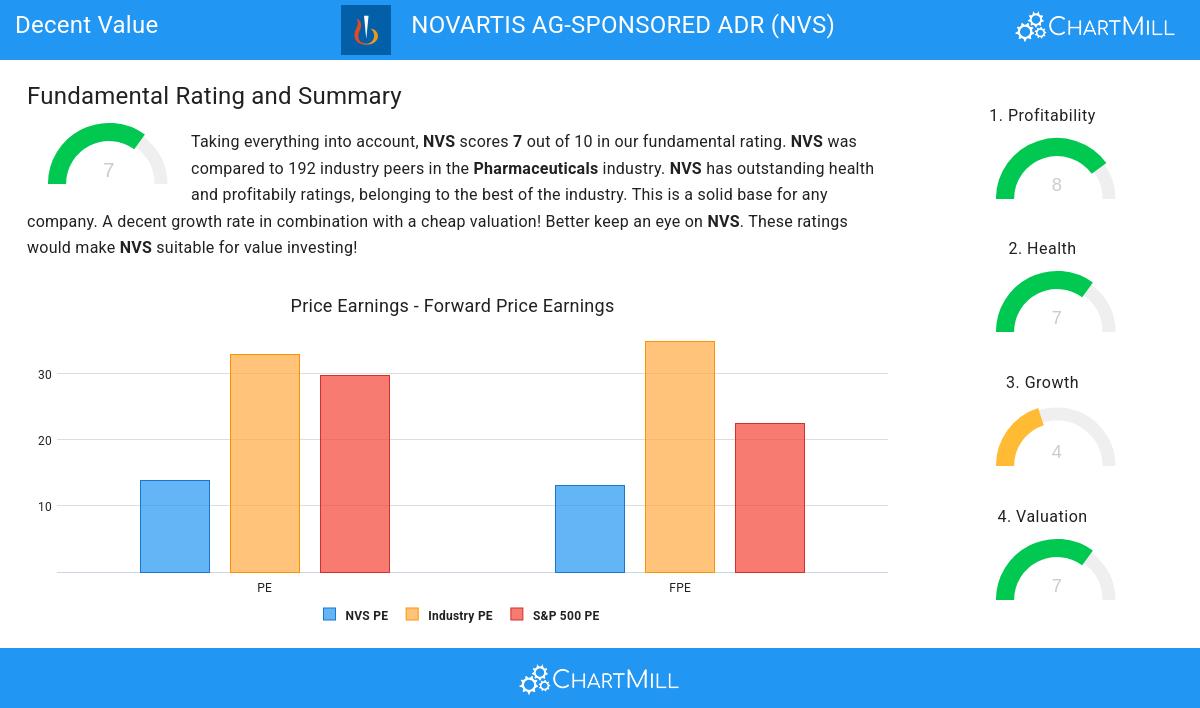
To assess a stock's valuation, ChartMill utilizes a Valuation Rating on a scale of 0 to 10. This comprehensive assessment considers various valuation aspects, comparing price to earnings and cash flows, while factoring in profitability and growth. NYSE:NVS has achieved a 7 out of 10:
- Based on the Price/Earnings ratio, NVS is valued cheaply inside the industry as 88.04% of the companies are valued more expensively.
- When comparing the Price/Earnings ratio of NVS to the average of the S&P500 Index (29.75), we can say NVS is valued rather cheaply.
- Based on the Price/Forward Earnings ratio, NVS is valued cheaper than 84.24% of the companies in the same industry.
- When comparing the Price/Forward Earnings ratio of NVS to the average of the S&P500 Index (22.44), we can say NVS is valued slightly cheaper.
- NVS's Enterprise Value to EBITDA ratio is rather cheap when compared to the industry. NVS is cheaper than 83.70% of the companies in the same industry.
- Compared to the rest of the industry, the Price/Free Cash Flow ratio of NVS indicates a rather cheap valuation: NVS is cheaper than 88.59% of the companies listed in the same industry.
- The excellent profitability rating of NVS may justify a higher PE ratio.
Evaluating Profitability: NYSE:NVS
Discover ChartMill's exclusive Profitability Rating, a proprietary metric that assesses stocks on a scale of 0 to 10. It takes into consideration various profitability ratios and margins, both in absolute terms and relative to industry peers. Notably, NYSE:NVS has achieved a 8:
- With an excellent Return On Assets value of 12.25%, NVS belongs to the best of the industry, outperforming 95.65% of the companies in the same industry.
- With an excellent Return On Equity value of 28.61%, NVS belongs to the best of the industry, outperforming 96.20% of the companies in the same industry.
- With an excellent Return On Invested Capital value of 21.20%, NVS belongs to the best of the industry, outperforming 96.20% of the companies in the same industry.
- The last Return On Invested Capital (21.20%) for NVS is above the 3 year average (14.58%), which is a sign of increasing profitability.
- NVS has a Profit Margin of 23.09%. This is amongst the best in the industry. NVS outperforms 94.02% of its industry peers.
- NVS's Operating Margin of 31.57% is amongst the best of the industry. NVS outperforms 94.02% of its industry peers.
- NVS's Operating Margin has improved in the last couple of years.
- NVS has a better Gross Margin (75.22%) than 81.52% of its industry peers.
Health Analysis for NYSE:NVS
ChartMill employs its own Health Rating for stock assessment. This rating, ranging from 0 to 10, is calculated by examining various liquidity and solvency ratios. In the case of NYSE:NVS, the assigned 7 reflects its health status:
- NVS has an Altman-Z score of 4.00. This indicates that NVS is financially healthy and has little risk of bankruptcy at the moment.
- With a decent Altman-Z score value of 4.00, NVS is doing good in the industry, outperforming 77.72% of the companies in the same industry.
- NVS has a debt to FCF ratio of 2.10. This is a good value and a sign of high solvency as NVS would need 2.10 years to pay back of all of its debts.
- NVS has a Debt to FCF ratio of 2.10. This is amongst the best in the industry. NVS outperforms 93.48% of its industry peers.
- Although NVS does not score too well on debt/equity it has very limited outstanding debt, which is well covered by the FCF. We will not put too much weight on the debt/equity number as it may be because of low equity, which could be a consequence of a share buyback program for instance. This needs to be investigated.
- NVS does not score too well on the current and quick ratio evaluation. However, as it has excellent solvency and profitability, these ratios do not necessarly indicate liquidity issues and need to be evaluated against the specifics of the business.
What does the Growth looks like for NYSE:NVS
To evaluate a stock's growth potential, ChartMill utilizes a Growth Rating on a scale of 0 to 10. This comprehensive assessment considers various growth aspects, including historical and estimated EPS and revenue growth. NYSE:NVS has achieved a 4 out of 10:
- The Earnings Per Share has grown by an nice 13.19% over the past year.
- Measured over the past years, NVS shows a quite strong growth in Earnings Per Share. The EPS has been growing by 8.14% on average per year.
- When comparing the Revenue growth rate of the last years to the growth rate of the upcoming years, we see that the growth is accelerating.
Our Decent Value screener lists more Decent Value stocks and is updated daily.
Check the latest full fundamental report of NVS for a complete fundamental analysis.
Disclaimer
This article should in no way be interpreted as advice. The article is based on the observed metrics at the time of writing, but you should always make your own analysis and trade or invest at your own responsibility.
NYSE:NVS (4/25/2025, 3:08:01 PM)
111.985
+0.81 (+0.73%)
Find more stocks in the Stock Screener
NVS Latest News and Analysis
 a day ago - ChartmillNOVARTIS AG-SPONSORED ADR (NYSE:NVS) is a prime example of a stock that offers more than what meets the eye in terms of fundamentals.
NOVARTIS AG-SPONSORED ADR has a stellar value proposition. NYSE:NVS not only scores well in profitability, solvency, and liquidity but also maintains a very reasonable price point.
