Investors should take note of NOVO-NORDISK A/S-SPONS ADR (NYSE:NVO), a growth stock that remains attractively priced.
By Mill Chart
Last update: Mar 4, 2025
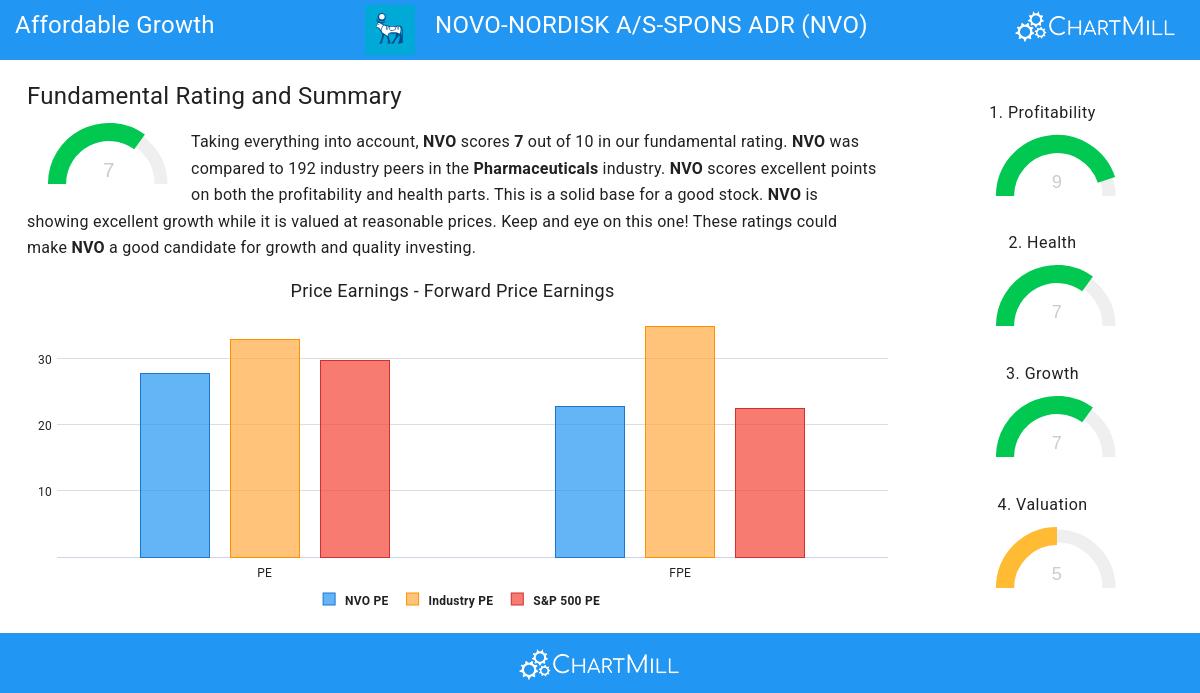
NOVO-NORDISK A/S-SPONS ADR (NYSE:NVO) was identified as an affordable growth stock by our stock screener. NYSE:NVO is showing great growth, but also scores well on profitability, solvency and liquidity. At the same time it seems to be priced reasonably. We'll explore this a bit deeper below.
Looking at the Growth
ChartMill assigns a proprietary Growth Rating to each stock. The score is computed by evaluating various growth aspects, like EPS and revenue growth. We take into account the history as well as the estimated future numbers. NYSE:NVO was assigned a score of 7 for growth:
- NVO shows a strong growth in Earnings Per Share. In the last year, the EPS has been growing by 22.49%, which is quite impressive.
- Looking at the last year, NVO shows a very strong growth in Revenue. The Revenue has grown by 25.03%.
- Measured over the past years, NVO shows a quite strong growth in Revenue. The Revenue has been growing by 18.94% on average per year.
- NVO is expected to show quite a strong growth in Earnings Per Share. In the coming years, the EPS will grow by 15.44% yearly.
- Based on estimates for the next years, NVO will show a quite strong growth in Revenue. The Revenue will grow by 13.05% on average per year.
- When comparing the EPS growth rate of the last years to the growth rate of the upcoming years, we see that the growth is accelerating.
Assessing Valuation for NYSE:NVO
ChartMill assigns a Valuation Rating to each stock, ranging from 0 to 10. This rating is calculated by analyzing different valuation elements, such as price to earnings and free cash flow, both in absolute terms and relative to the market and industry. In the case of NYSE:NVO, the assigned 5 reflects its valuation:
- Compared to the rest of the industry, the Price/Earnings ratio of NVO indicates a rather cheap valuation: NVO is cheaper than 83.15% of the companies listed in the same industry.
- NVO's Price/Forward Earnings ratio is a bit cheaper when compared to the industry. NVO is cheaper than 79.35% of the companies in the same industry.
- Compared to the rest of the industry, the Enterprise Value to EBITDA ratio of NVO indicates a rather cheap valuation: NVO is cheaper than 80.43% of the companies listed in the same industry.
- 79.89% of the companies in the same industry are more expensive than NVO, based on the Price/Free Cash Flow ratio.
- NVO has an outstanding profitability rating, which may justify a higher PE ratio.
- A more expensive valuation may be justified as NVO's earnings are expected to grow with 19.03% in the coming years.
Health Insights: NYSE:NVO
ChartMill assigns a proprietary Health Rating to each stock. The score is computed by evaluating various liquidity and solvency ratios and ranges from 0 to 10. NYSE:NVO was assigned a score of 7 for health:
- An Altman-Z score of 7.12 indicates that NVO is not in any danger for bankruptcy at the moment.
- Looking at the Altman-Z score, with a value of 7.12, NVO belongs to the top of the industry, outperforming 83.70% of the companies in the same industry.
- NVO has a debt to FCF ratio of 1.48. This is a very positive value and a sign of high solvency as it would only need 1.48 years to pay back of all of its debts.
- Looking at the Debt to FCF ratio, with a value of 1.48, NVO belongs to the top of the industry, outperforming 95.11% of the companies in the same industry.
- Although NVO does not score too well on debt/equity it has very limited outstanding debt, which is well covered by the FCF. We will not put too much weight on the debt/equity number as it may be because of low equity, which could be a consequence of a share buyback program for instance. This needs to be investigated.
- The current and quick ratio evaluation for NVO is rather negative, while it does have excellent solvency and profitability. These ratios do not necessarly indicate liquidity issues and need to be evaluated against the specifics of the business.
Profitability Insights: NYSE:NVO
ChartMill's Profitability Rating offers a unique perspective on stock analysis, providing scores from 0 to 10. These ratings consider a wide range of profitability metrics and margins, both in comparison to industry peers and on their own merits. For NYSE:NVO, the assigned 9 is a significant indicator of profitability:
- With an excellent Return On Assets value of 21.68%, NVO belongs to the best of the industry, outperforming 98.91% of the companies in the same industry.
- Looking at the Return On Equity, with a value of 70.38%, NVO belongs to the top of the industry, outperforming 98.37% of the companies in the same industry.
- Looking at the Return On Invested Capital, with a value of 43.02%, NVO belongs to the top of the industry, outperforming 97.83% of the companies in the same industry.
- Measured over the past 3 years, the Average Return On Invested Capital for NVO is significantly above the industry average of 44.16%.
- The last Return On Invested Capital (43.02%) for NVO is well below the 3 year average (50.29%), which needs to be investigated, but indicates that NVO had better years and this may not be a problem.
- NVO's Profit Margin of 34.78% is amongst the best of the industry. NVO outperforms 96.74% of its industry peers.
- In the last couple of years the Profit Margin of NVO has grown nicely.
- Looking at the Operating Margin, with a value of 46.16%, NVO belongs to the top of the industry, outperforming 98.37% of the companies in the same industry.
- In the last couple of years the Operating Margin of NVO has grown nicely.
- With an excellent Gross Margin value of 84.67%, NVO belongs to the best of the industry, outperforming 90.76% of the companies in the same industry.
Every day, new Affordable Growth stocks can be found on ChartMill in our Affordable Growth screener.
Check the latest full fundamental report of NVO for a complete fundamental analysis.
Disclaimer
This article should in no way be interpreted as advice. The article is based on the observed metrics at the time of writing, but you should always make your own analysis and trade or invest at your own responsibility.
62.63
+1.33 (+2.17%)
Find more stocks in the Stock Screener
NVO Latest News and Analysis
 8 days ago - ChartmillWhile growth is established for NOVO-NORDISK A/S-SPONS ADR (NYSE:NVO), the stock's valuation remains reasonable.
Discover NOVO-NORDISK A/S-SPONS ADR, an undervalued growth gem. NYSE:NVO is shining in terms of growth metrics, and it's also displaying strong financial health and profitability, retaining an appealing valuation.
 20 days ago - ChartmillNOVO-NORDISK A/S-SPONS ADR (NYSE:NVO): good value for what you're paying.
NOVO-NORDISK A/S-SPONS ADR may be an undervalued stock option. NYSE:NVO retains a strong financial foundation and an attractive price tag.
