
NOVO-NORDISK A/S-SPONS ADR (NYSE:NVO): good value for what you're paying.
By Mill Chart
Last update: Apr 5, 2025
NOVO-NORDISK A/S-SPONS ADR (NYSE:NVO) has caught the attention of our stock screener as a great value stock. NVO excels in profitability, solvency, and liquidity, all while being very reasonably priced. Let's delve into the details.
Unpacking NVO's Valuation Rating
ChartMill assigns a Valuation Rating to each stock, ranging from 0 to 10. This rating is calculated by analyzing different valuation elements, such as price to earnings and free cash flow, both in absolute terms and relative to the market and industry. In the case of NVO, the assigned 7 reflects its valuation:
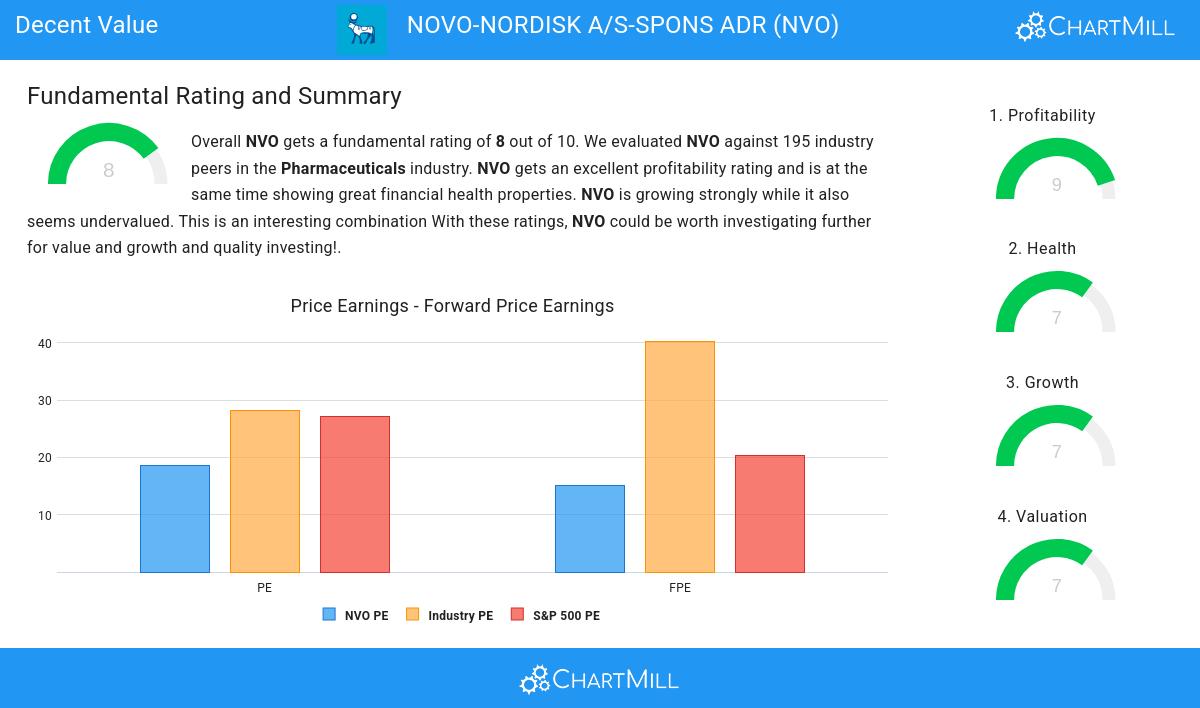
- Based on the Price/Earnings ratio, NVO is valued cheaper than 83.08% of the companies in the same industry.
- The average S&P500 Price/Earnings ratio is at 27.10. NVO is valued slightly cheaper when compared to this.
- 82.05% of the companies in the same industry are more expensive than NVO, based on the Price/Forward Earnings ratio.
- Compared to an average S&P500 Price/Forward Earnings ratio of 20.33, NVO is valued a bit cheaper.
- 82.05% of the companies in the same industry are more expensive than NVO, based on the Enterprise Value to EBITDA ratio.
- Compared to the rest of the industry, the Price/Free Cash Flow ratio of NVO indicates a rather cheap valuation: NVO is cheaper than 82.05% of the companies listed in the same industry.
- NVO's low PEG Ratio(NY), which compensates the Price/Earnings for growth, indicates a rather cheap valuation of the company.
- The excellent profitability rating of NVO may justify a higher PE ratio.
- A more expensive valuation may be justified as NVO's earnings are expected to grow with 19.38% in the coming years.
Looking at the Profitability
ChartMill utilizes a Profitability Rating to assess stocks, scoring them on a scale of 0 to 10. This rating takes into account a variety of profitability ratios and margins, both in absolute terms and in comparison to industry peers. NVO has earned a 9 out of 10:
- The Return On Assets of NVO (21.68%) is better than 98.46% of its industry peers.
- Looking at the Return On Equity, with a value of 70.38%, NVO belongs to the top of the industry, outperforming 98.46% of the companies in the same industry.
- NVO has a Return On Invested Capital of 43.02%. This is amongst the best in the industry. NVO outperforms 97.95% of its industry peers.
- The Average Return On Invested Capital over the past 3 years for NVO is significantly above the industry average of 43.56%.
- The last Return On Invested Capital (43.02%) for NVO is well below the 3 year average (50.29%), which needs to be investigated, but indicates that NVO had better years and this may not be a problem.
- NVO has a better Profit Margin (34.78%) than 96.92% of its industry peers.
- NVO's Profit Margin has improved in the last couple of years.
- The Operating Margin of NVO (46.16%) is better than 97.95% of its industry peers.
- In the last couple of years the Operating Margin of NVO has grown nicely.
- The Gross Margin of NVO (84.67%) is better than 89.23% of its industry peers.
ChartMill's Evaluation of Health
A critical element of ChartMill's stock evaluation is the Health Rating, which spans from 0 to 10. This rating considers multiple health factors, including liquidity and solvency, both in absolute terms and relative to industry peers. NVO has received a 7 out of 10:
- NVO has an Altman-Z score of 5.59. This indicates that NVO is financially healthy and has little risk of bankruptcy at the moment.
- NVO has a Altman-Z score of 5.59. This is amongst the best in the industry. NVO outperforms 84.62% of its industry peers.
- The Debt to FCF ratio of NVO is 1.48, which is an excellent value as it means it would take NVO, only 1.48 years of fcf income to pay off all of its debts.
- NVO's Debt to FCF ratio of 1.48 is amongst the best of the industry. NVO outperforms 95.38% of its industry peers.
- Even though the debt/equity ratio score it not favorable for NVO, it has very limited outstanding debt, so we won't put too much weight on the DE evaluation.
- The current and quick ratio evaluation for NVO is rather negative, while it does have excellent solvency and profitability. These ratios do not necessarly indicate liquidity issues and need to be evaluated against the specifics of the business.
Looking at the Growth
ChartMill assigns a Growth Rating to each stock, ranging from 0 to 10. This rating is determined by analyzing different growth elements, including EPS and revenue growth, spanning both historical and future figures. In the case of NVO, the assigned 7 reflects its growth potential:
- The Earnings Per Share has grown by an impressive 21.57% over the past year.
- The Revenue has grown by 25.03% in the past year. This is a very strong growth!
- The Revenue has been growing by 18.94% on average over the past years. This is quite good.
- The Earnings Per Share is expected to grow by 14.90% on average over the next years. This is quite good.
- Based on estimates for the next years, NVO will show a quite strong growth in Revenue. The Revenue will grow by 12.92% on average per year.
- When comparing the EPS growth rate of the last years to the growth rate of the upcoming years, we see that the growth is accelerating.
Our Decent Value screener lists more Decent Value stocks and is updated daily.
Our latest full fundamental report of NVO contains the most current fundamental analsysis.
Disclaimer
This is not investing advice! The article highlights some of the observations at the time of writing, but you should always make your own analysis and invest based on your own insights.
62.08
-0.55 (-0.88%)
Find more stocks in the Stock Screener
NVO Latest News and Analysis
 9 days ago - ChartmillWhile growth is established for NOVO-NORDISK A/S-SPONS ADR (NYSE:NVO), the stock's valuation remains reasonable.
Discover NOVO-NORDISK A/S-SPONS ADR, an undervalued growth gem. NYSE:NVO is shining in terms of growth metrics, and it's also displaying strong financial health and profitability, retaining an appealing valuation.
