Why NVIDIA CORP (NASDAQ:NVDA) qualifies as a high growth stock.
By Mill Chart
Last update: Feb 11, 2025
In this article we will dive into NVIDIA CORP (NASDAQ:NVDA) as a possible candidate for growth investing. Investors should always do their own research, but we noticed NVIDIA CORP showing up in our CANSLIM growth screen, which makes it worth to investigate a bit more.
What matters for canslim investors.
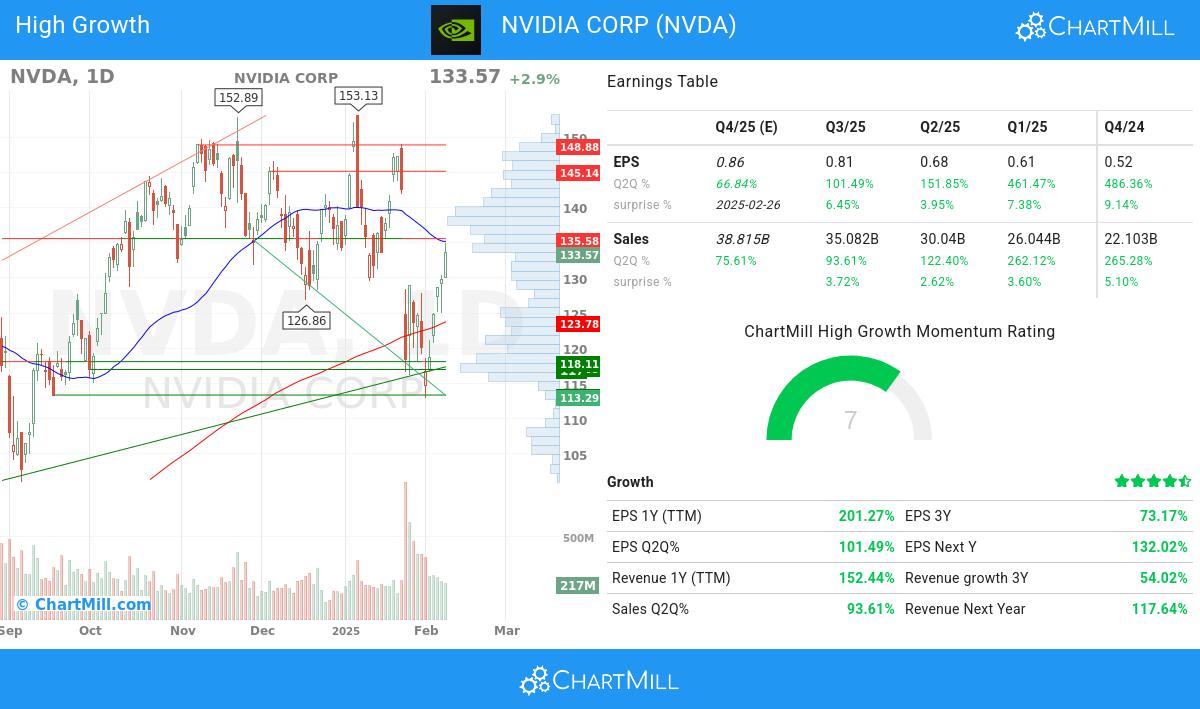
- NVIDIA CORP has demonstrated consistent growth in its earnings per share (EPS) from one quarter to another (Q2Q), with a 101.0% increase. This indicates improving financial performance and the company's effective management of its operations.
- The q2q revenue growth of 93.61% of NVIDIA CORP highlights the company's ability to generate incremental revenue and suggests positive market demand for its products or services.
- Over the past 3 years, NVIDIA CORP has demonstrated 73.17% growth in EPS, signifying its positive financial trajectory and potential for future profitability.
- The Return on Equity (ROE) of NVIDIA CORP stands at 95.71%, reflecting the company's strong profitability and effective utilization of shareholder equity. This metric signifies the company's ability to generate returns for its investors.
- NVIDIA CORP has achieved an impressive Relative Strength (RS) rating of 91.0, showcasing its ability to outperform the broader market. This strong performance positions NVIDIA CORP as an attractive stock for potential price appreciation.
- With a Debt-to-Equity ratio at 0.13, NVIDIA CORP showcases its prudent financial management. The company's balanced approach between debt and equity reflects its commitment to maintaining a stable capital structure.
- With 66.85% of the total shares held by institutional investors, NVIDIA CORP showcases a healthy distribution of ownership. This suggests a mix of institutional and retail investors, fostering a dynamic market for the stock.
Technical Analysis Observations
ChartMill assigns a proprietary Technical Rating to each stock. The score is computed daily by evaluating various technical indicators and properties. The score ranges from 0 to 10.
Overall NVDA gets a technical rating of 5 out of 10. Although NVDA is scoring some points because its good overall performance in the market in the past year, recent evolutions are not that positive. Both the medium and short term picture give negative signs.
- When comparing the yearly performance of all stocks, we notice that NVDA is one of the better performing stocks in the market, outperforming 91% of all stocks. On top of that, NVDA also shows a nice and consistent pattern of rising prices.
- NVDA is part of the Semiconductors & Semiconductor Equipment industry. There are 108 other stocks in this industry. NVDA outperforms 88% of them.
- NVDA is currently trading in the upper part of its 52 week range. The S&P500 Index however is currently trading near a new high, so NVDA is lagging the market slightly.
- The long and short term trends are both neutral. This gives a pretty neutral overall picture!
- In the last month NVDA has a been trading in the 113.01 - 148.97 range, which is quite wide. It is currently trading in the middle of this range, so some resistance may be found above.
Check the latest full technical report of NVDA for a complete technical analysis.
Fundamental analysis of NASDAQ:NVDA
Every day ChartMill assigns a Fundamental Rating to every stock. The score ranges from 0 to 10 and is determined by evaluating multiple fundamental indicators and properties.
We assign a fundamental rating of 8 out of 10 to NVDA. NVDA was compared to 108 industry peers in the Semiconductors & Semiconductor Equipment industry. NVDA scores excellent points on both the profitability and health parts. This is a solid base for a good stock. NVDA is not priced too expensively while it is growing strongly. Keep and eye on this one! These ratings would make NVDA suitable for growth and quality investing!
For an up to date full fundamental analysis you can check the fundamental report of NVDA
Our CANSLIM screen will find you more ideas suited for growth investing.
Disclaimer
This article should in no way be interpreted as advice. The article is based on the observed metrics at the time of writing, but you should always make your own analysis and trade or invest at your own responsibility.
NVIDIA CORP
NASDAQ:NVDA (2/10/2025, 8:15:25 PM)
Premarket: 132.32 -1.25 (-0.94%)133.57
+3.73 (+2.87%)
NVDA Latest News and Analysis
 4 minutes ago - ChartmillWhy NVIDIA CORP (NASDAQ:NVDA) qualifies as a high growth stock.
Based on fundamental analysis, it turns out that NVIDIA CORP (NASDAQ:NVDA) may be suited for growth investing, we'll explore why in this article.
 17 hours ago - ChartmillExplore the S&P500 index on Monday and find out which stocks are the most active in today's session.
Curious about the most active S&P500 stocks in today's session? Join us as we explore the US markets on Monday and uncover the stocks that are leading the way in terms of trading volume and market attention.
17 hours ago - ChartmillMonday's session: most active stocksLet's have a look at what is happening on the US markets on Monday. Below you can find the most active stocks in today's session.
4 days ago - ChartmillMost active S&P500 stocks in Friday's sessionExplore the S&P500 index on Friday and find out which stocks are the most active in today's session. Stay updated with the stocks that are capturing market interest.
