
Our stock screening tool has pinpointed NVIDIA CORP (NASDAQ:NVDA) as a growth stock that isn't overvalued. NASDAQ:NVDA is excelling in various growth indicators while maintaining a solid financial footing. Furthermore, it remains attractively priced. Let's delve into the specifics below.
Understanding NASDAQ:NVDA's Growth Score
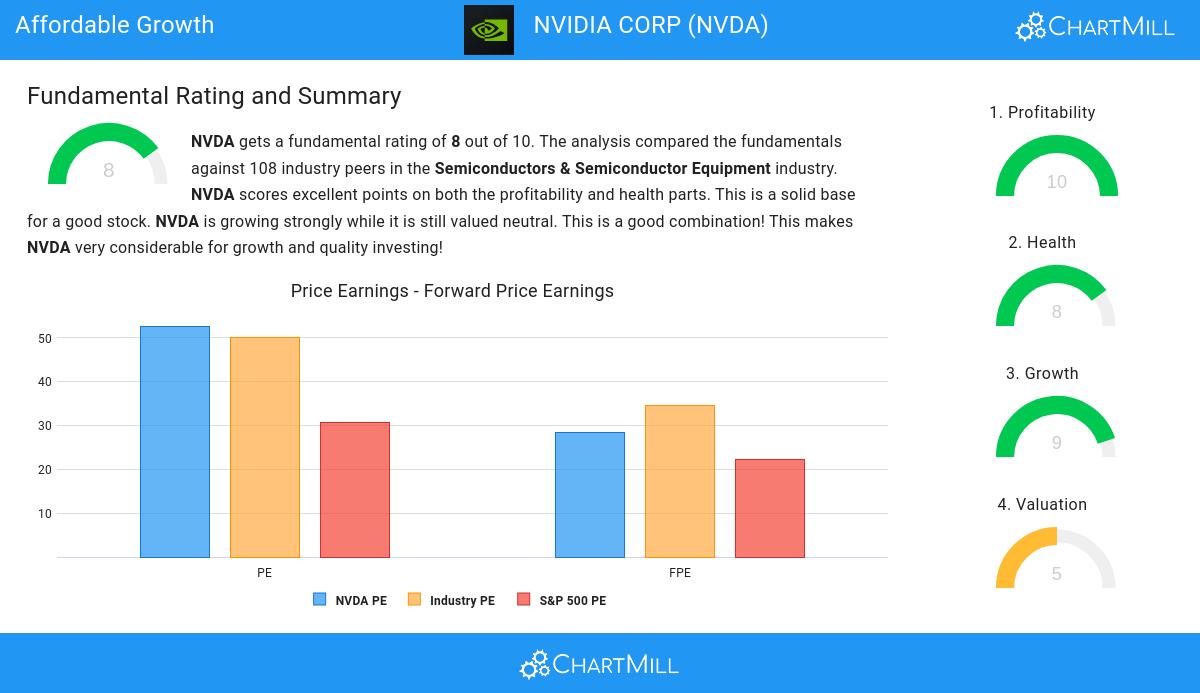
Every stock receives a Growth Rating from ChartMill, ranging from 0 to 10. This rating assesses various growth aspects, including historical and projected EPS and revenue growth. NASDAQ:NVDA boasts a 9 out of 10:
- The Earnings Per Share has grown by an impressive 320.95% over the past year.
- Measured over the past years, NVDA shows a very strong growth in Earnings Per Share. The EPS has been growing by 50.90% on average per year.
- The Revenue has grown by 194.69% in the past year. This is a very strong growth!
- The Revenue has been growing by 39.06% on average over the past years. This is a very strong growth!
- The Earnings Per Share is expected to grow by 35.09% on average over the next years. This is a very strong growth
- NVDA is expected to show a strong growth in Revenue. In the coming years, the Revenue will grow by 32.85% yearly.
How We Gauge Valuation for NASDAQ:NVDA
ChartMill assigns a proprietary Valuation Rating to each stock. The score is computed by evaluating various valuation aspects, like price to earnings and free cash flow, both absolutely as relative to the market and industry. NASDAQ:NVDA was assigned a score of 5 for valuation:
- Compared to the rest of the industry, the Price/Free Cash Flow ratio of NVDA indicates a somewhat cheap valuation: NVDA is cheaper than 62.04% of the companies listed in the same industry.
- NVDA's low PEG Ratio(NY), which compensates the Price/Earnings for growth, indicates a rather cheap valuation of the company.
- The excellent profitability rating of NVDA may justify a higher PE ratio.
- NVDA's earnings are expected to grow with 54.70% in the coming years. This may justify a more expensive valuation.
Understanding NASDAQ:NVDA's Health
Every stock is evaluated by ChartMill, receiving a Health Rating on a scale of 0 to 10. This assessment considers different health aspects, including liquidity and solvency, both in absolute terms and relative to industry peers. NASDAQ:NVDA has achieved a 8 out of 10:
- NVDA has an Altman-Z score of 68.05. This indicates that NVDA is financially healthy and has little risk of bankruptcy at the moment.
- NVDA's Altman-Z score of 68.05 is amongst the best of the industry. NVDA outperforms 97.22% of its industry peers.
- NVDA has a debt to FCF ratio of 0.18. This is a very positive value and a sign of high solvency as it would only need 0.18 years to pay back of all of its debts.
- Looking at the Debt to FCF ratio, with a value of 0.18, NVDA belongs to the top of the industry, outperforming 84.26% of the companies in the same industry.
- A Debt/Equity ratio of 0.15 indicates that NVDA is not too dependend on debt financing.
- A Current Ratio of 4.27 indicates that NVDA has no problem at all paying its short term obligations.
- NVDA has a Current ratio of 4.27. This is in the better half of the industry: NVDA outperforms 64.81% of its industry peers.
- NVDA has a Quick Ratio of 3.79. This indicates that NVDA is financially healthy and has no problem in meeting its short term obligations.
- NVDA has a Quick ratio of 3.79. This is in the better half of the industry: NVDA outperforms 70.37% of its industry peers.
Looking at the Profitability
ChartMill employs its own Profitability Rating system for stock evaluation. This score, ranging from 0 to 10, is derived from an analysis of diverse profitability metrics and margins. In the case of NASDAQ:NVDA, the assigned 10 is noteworthy for profitability:
- Looking at the Return On Assets, with a value of 62.20%, NVDA belongs to the top of the industry, outperforming 100.00% of the companies in the same industry.
- NVDA has a better Return On Equity (91.15%) than 100.00% of its industry peers.
- NVDA has a Return On Invested Capital of 73.58%. This is amongst the best in the industry. NVDA outperforms 100.00% of its industry peers.
- Measured over the past 3 years, the Average Return On Invested Capital for NVDA is significantly above the industry average of 10.86%.
- The last Return On Invested Capital (73.58%) for NVDA is above the 3 year average (31.07%), which is a sign of increasing profitability.
- NVDA has a Profit Margin of 55.04%. This is amongst the best in the industry. NVDA outperforms 99.07% of its industry peers.
- NVDA's Profit Margin has improved in the last couple of years.
- With an excellent Operating Margin value of 61.87%, NVDA belongs to the best of the industry, outperforming 99.07% of the companies in the same industry.
- In the last couple of years the Operating Margin of NVDA has grown nicely.
- Looking at the Gross Margin, with a value of 75.98%, NVDA belongs to the top of the industry, outperforming 94.44% of the companies in the same industry.
- In the last couple of years the Gross Margin of NVDA has grown nicely.
More Affordable Growth stocks can be found in our Affordable Growth screener.
For an up to date full fundamental analysis you can check the fundamental report of NVDA
Disclaimer
Important Note: The content of this article is not intended as trading advice. It is essential to perform your own analysis and exercise caution when making trading decisions. The article presents observations created by automated analysis but does not guarantee any trading or investment outcomes. Always trade responsibly and make independent judgments.