Buying stocks that show a temporary pullback within their existing rising trend is a strategy that offers great opportunities for both long-term investors and more active swing traders.
The question is always how to find such stocks. There are undoubtedly many different ways and angles.
In this post, I briefly explain one Trading Idea available in the stock screener ChartMill. It is based on the Bollinger Bands indicator and includes the following screening filters:
General Filters
- Exchange: US common stocks only
- Price: Above $5
- Average volume: 50SMA > 500K
These basic filters ensure that we avoid penny stocks and only hold stocks with sufficient liquidity.
Trend Filter
- Price above SMA(200)
A simple basic filter that ensures we only hold stocks whose long-term momentum is bullish. You can also add some conditions based on shorter averages, specifying medium and/or short term. Mark Minervini's Trend Template is a good example of this.
Signal Filters
- The current closing price is above the previous day's high, meaning the last candle closed positive
- The closing price of yesterday's candle was below the lower Bollinger Band.
- The current closing price is above the lower Bollinger Band.
Optional signal filter
- The % change from open (last close) is positive
The signal filters give us the actual setup we are looking for. Stocks that have fallen below the lower Bollinger Band and then suddenly show a strong rise that not only brings the price back above the lower Bollinger Band, but also higher than the highest price of the previous candle. Such price action shows strength and momentum and is an indication of a possible recovery move.
Results
This filter usually produces a very limited number of candidates. Applied to Wednesday's July 31 closing price, there are exactly 2.
Most notable result? NVIDIA (NVDA)
The other stock concerns HELIX ENERGY SOLUTIONS GROUP (HLX)
Daily chart NVDA
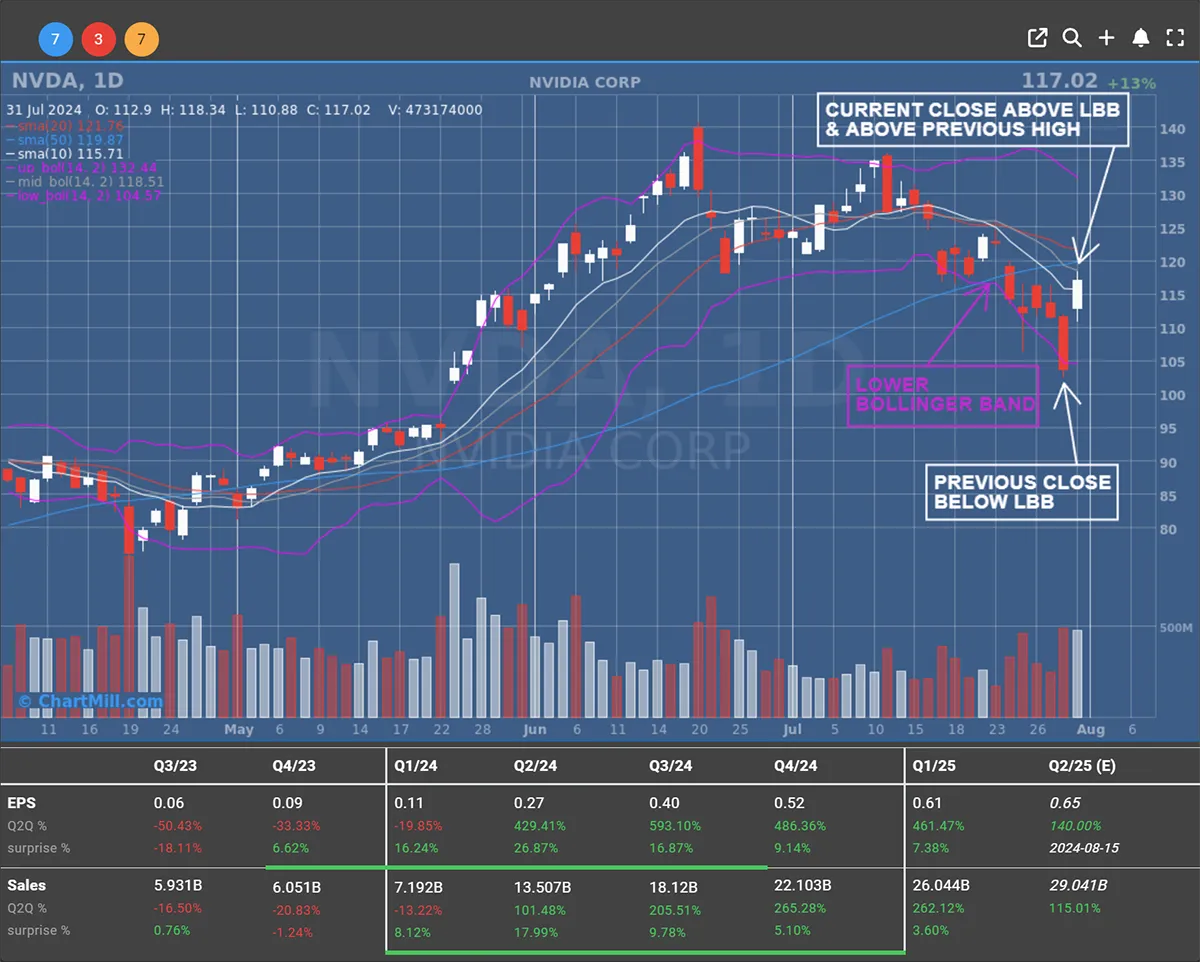
A basic setup for NVDA would be an entry just above the high of the most recent candle ($118.34) with a stop loss below the last swing low ($102.54).
In that case the difference between entry and stop loss is just under 14% which is quite large. This does not have to be a problem for those who take a position with the intention of holding it for a long time.
Active traders can opt to zoom in on an intraday chart with 60m or 4h intervals and use a somewhat shorter stop loss based on that information.
Daily chart HLX
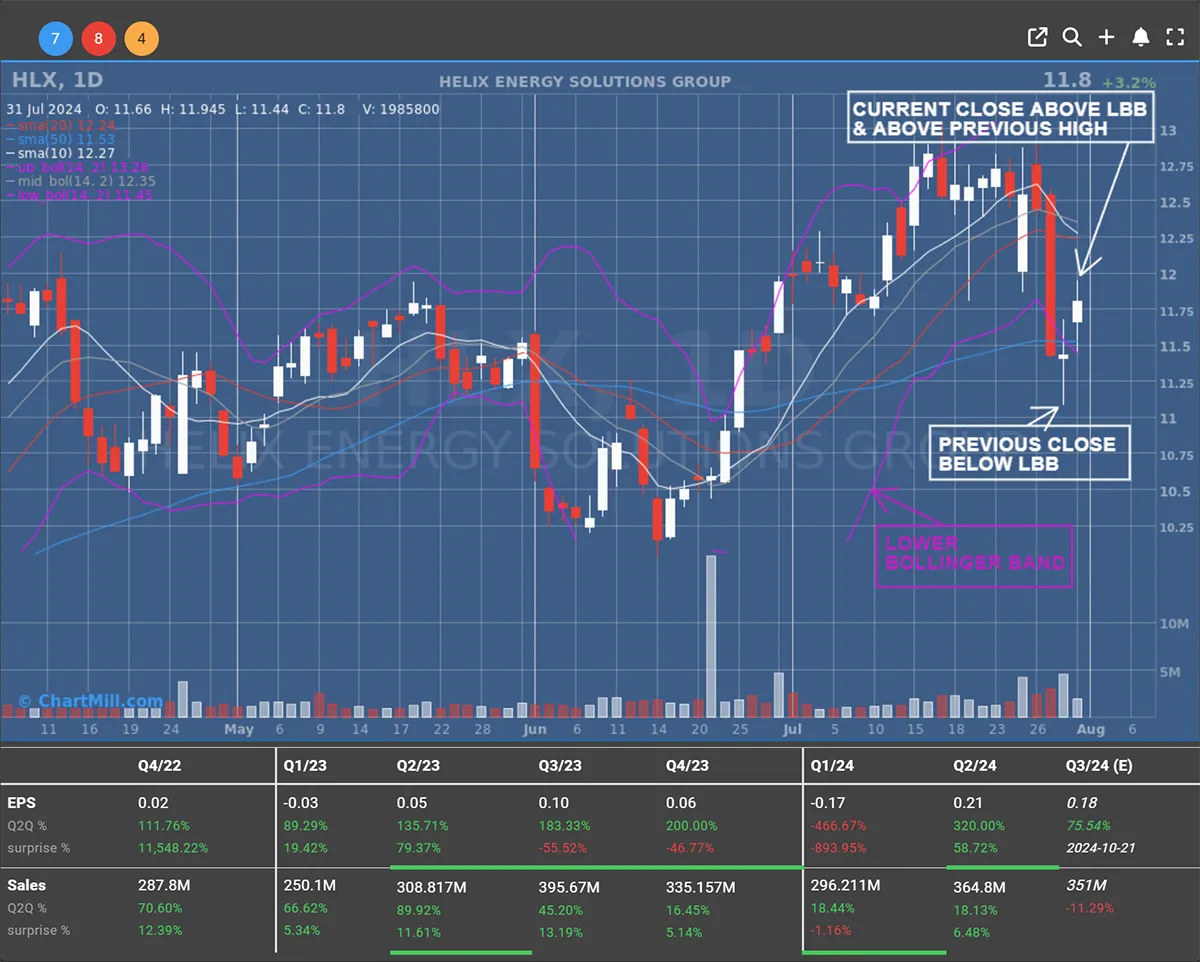
Applied to HLX, this gives an entry just above $11.95 and an initial stop loss below $11.08.
The risk per share in that case is about 7.5%, which is ideal for a typical swing trade.
This and many other trading ideas can be found on our Trading Ideas page. The results produced by these screens automatically adjust after each trading day.
By the way, did you know that you can expand/customize each of these predefined filters to your liking and then save them as a personal screen in your account?
Feel free to try it yourself!
The ChartMill Team