
Is NETEASE INC-ADR (NASDAQ:NTES) a Good Fit for Dividend Investing?
By Mill Chart
Last update: Feb 27, 2025
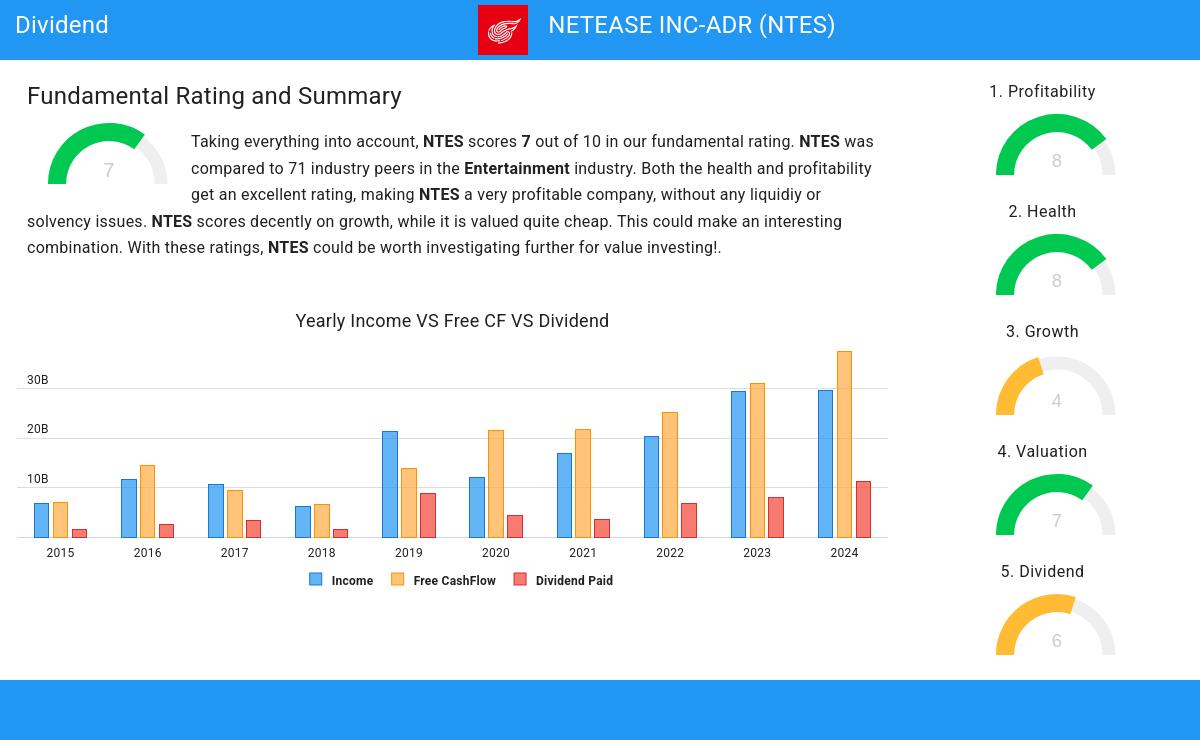
Consider NETEASE INC-ADR (NASDAQ:NTES) as a top pick for dividend investors, identified by our stock screening tool. NASDAQ:NTES shines in terms of profitability, solvency, and liquidity, all while paying a decent dividend. Let's dive deeper into the analysis.
Assessing Dividend for NASDAQ:NTES
To gauge a stock's dividend quality, ChartMill utilizes a Dividend Rating ranging from 0 to 10. This comprehensive assessment considers various dividend aspects, including yield, history, growth, and sustainability. NASDAQ:NTES has achieved a 6 out of 10:
- Compared to an average industry Dividend Yield of 4.99, NTES pays a better dividend. On top of this NTES pays more dividend than 93.94% of the companies listed in the same industry.
- NTES's Dividend Yield is rather good when compared to the S&P500 average which is at 2.27.
- NTES has been paying a dividend for at least 10 years, so it has a reliable track record.
- 37.60% of the earnings are spent on dividend by NTES. This is a low number and sustainable payout ratio.
Evaluating Health: NASDAQ:NTES
ChartMill utilizes a Health Rating to assess stocks, scoring them on a scale of 0 to 10. This rating takes into account a variety of liquidity and solvency ratios, both in absolute terms and in comparison to industry peers. NASDAQ:NTES has earned a 8 out of 10:
- The Debt to FCF ratio of NTES is 0.33, which is an excellent value as it means it would take NTES, only 0.33 years of fcf income to pay off all of its debts.
- Looking at the Debt to FCF ratio, with a value of 0.33, NTES belongs to the top of the industry, outperforming 89.39% of the companies in the same industry.
- A Debt/Equity ratio of 0.09 indicates that NTES is not too dependend on debt financing.
- Looking at the Debt to Equity ratio, with a value of 0.09, NTES is in the better half of the industry, outperforming 72.73% of the companies in the same industry.
- NTES has a Current Ratio of 3.09. This indicates that NTES is financially healthy and has no problem in meeting its short term obligations.
- With an excellent Current ratio value of 3.09, NTES belongs to the best of the industry, outperforming 83.33% of the companies in the same industry.
- A Quick Ratio of 3.08 indicates that NTES has no problem at all paying its short term obligations.
- NTES has a better Quick ratio (3.08) than 83.33% of its industry peers.
How do we evaluate the Profitability for NASDAQ:NTES?
ChartMill utilizes a Profitability Rating to assess stocks, scoring them on a scale of 0 to 10. This rating takes into account a variety of profitability ratios and margins, both in absolute terms and in comparison to industry peers. NASDAQ:NTES has earned a 8 out of 10:
- NTES has a Return On Assets of 15.15%. This is amongst the best in the industry. NTES outperforms 93.94% of its industry peers.
- NTES's Return On Equity of 21.41% is amongst the best of the industry. NTES outperforms 87.88% of its industry peers.
- NTES has a Return On Invested Capital of 15.99%. This is amongst the best in the industry. NTES outperforms 95.45% of its industry peers.
- The 3 year average ROIC (14.54%) for NTES is below the current ROIC(15.99%), indicating increased profibility in the last year.
- With an excellent Profit Margin value of 28.20%, NTES belongs to the best of the industry, outperforming 95.45% of the companies in the same industry.
- NTES's Operating Margin of 28.10% is amongst the best of the industry. NTES outperforms 98.48% of its industry peers.
- NTES's Operating Margin has improved in the last couple of years.
- NTES has a Gross Margin of 62.50%. This is in the better half of the industry: NTES outperforms 69.70% of its industry peers.
- NTES's Gross Margin has improved in the last couple of years.
Our Best Dividend screener lists more Best Dividend stocks and is updated daily.
Our latest full fundamental report of NTES contains the most current fundamental analsysis.
Keep in mind
This is not investing advice! The article highlights some of the observations at the time of writing, but you should always make your own analysis and invest based on your own insights.
98.73
+1.32 (+1.36%)
Find more stocks in the Stock Screener
NTES Latest News and Analysis
 12 days ago - ChartmillNETEASE INC-ADR (NASDAQ:NTES) is an undervalued gem with solid fundamentals.
Consider NETEASE INC-ADR as a top value stock. NASDAQ:NTES shines in terms of profitability, solvency, and liquidity, all while remaining very reasonably priced.
