
Our stock screener has singled out NETEASE INC-ADR (NASDAQ:NTES) as a stellar value proposition. NASDAQ:NTES not only scores well in profitability, solvency, and liquidity but also maintains a very reasonable price point. We'll explore this further.
How We Gauge Valuation for NASDAQ:NTES
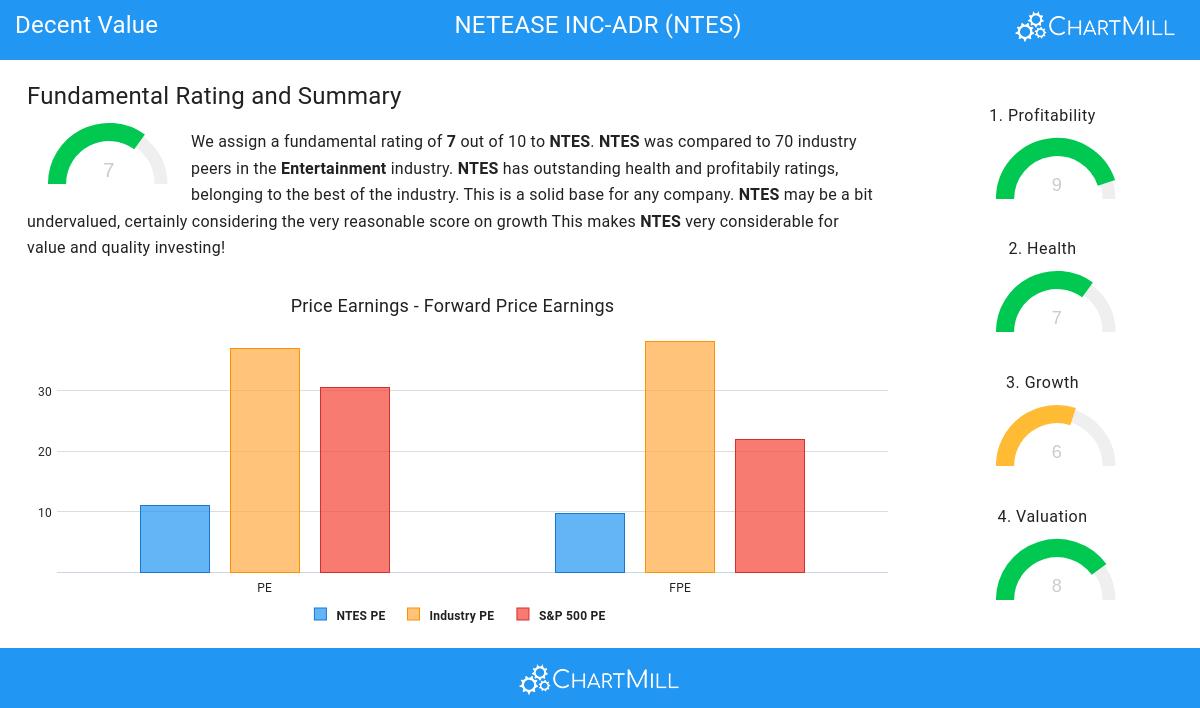
ChartMill assigns a Valuation Rating to each stock, ranging from 0 to 10. This rating is calculated by analyzing different valuation elements, such as price to earnings and free cash flow, both in absolute terms and relative to the market and industry. In the case of NASDAQ:NTES, the assigned 8 reflects its valuation:
- NTES is valuated reasonably with a Price/Earnings ratio of 11.01.
- 88.57% of the companies in the same industry are more expensive than NTES, based on the Price/Earnings ratio.
- NTES is valuated cheaply when we compare the Price/Earnings ratio to 30.52, which is the current average of the S&P500 Index.
- With a Price/Forward Earnings ratio of 9.76, the valuation of NTES can be described as very reasonable.
- Based on the Price/Forward Earnings ratio, NTES is valued cheaper than 91.43% of the companies in the same industry.
- Compared to an average S&P500 Price/Forward Earnings ratio of 21.99, NTES is valued rather cheaply.
- Based on the Enterprise Value to EBITDA ratio, NTES is valued cheaper than 82.86% of the companies in the same industry.
- Based on the Price/Free Cash Flow ratio, NTES is valued cheaper than 88.57% of the companies in the same industry.
- The excellent profitability rating of NTES may justify a higher PE ratio.
Profitability Assessment of NASDAQ:NTES
ChartMill utilizes a Profitability Rating to assess stocks, scoring them on a scale of 0 to 10. This rating takes into account a variety of profitability ratios and margins, both in absolute terms and in comparison to industry peers. NASDAQ:NTES has earned a 9 out of 10:
- NTES has a better Return On Assets (15.71%) than 95.71% of its industry peers.
- NTES has a Return On Equity of 22.01%. This is amongst the best in the industry. NTES outperforms 90.00% of its industry peers.
- NTES has a better Return On Invested Capital (15.95%) than 95.71% of its industry peers.
- The Average Return On Invested Capital over the past 3 years for NTES is above the industry average of 9.64%.
- The last Return On Invested Capital (15.95%) for NTES is above the 3 year average (12.62%), which is a sign of increasing profitability.
- NTES has a better Profit Margin (26.99%) than 97.14% of its industry peers.
- In the last couple of years the Profit Margin of NTES has grown nicely.
- The Operating Margin of NTES (27.21%) is better than 97.14% of its industry peers.
- NTES's Operating Margin has improved in the last couple of years.
- The Gross Margin of NTES (62.62%) is better than 72.86% of its industry peers.
- In the last couple of years the Gross Margin of NTES has grown nicely.
Health Assessment of NASDAQ:NTES
To gauge a stock's financial health, ChartMill utilizes a Health Rating on a scale of 0 to 10. This comprehensive evaluation encompasses liquidity and solvency, both in absolute terms and in comparison to industry peers. NASDAQ:NTES has earned a 7 out of 10:
- The Debt to FCF ratio of NTES is 0.39, which is an excellent value as it means it would take NTES, only 0.39 years of fcf income to pay off all of its debts.
- Looking at the Debt to FCF ratio, with a value of 0.39, NTES belongs to the top of the industry, outperforming 92.86% of the companies in the same industry.
- NTES has a Debt/Equity ratio of 0.10. This is a healthy value indicating a solid balance between debt and equity.
- Looking at the Debt to Equity ratio, with a value of 0.10, NTES is in the better half of the industry, outperforming 70.00% of the companies in the same industry.
- NTES has a Current Ratio of 3.01. This indicates that NTES is financially healthy and has no problem in meeting its short term obligations.
- The Current ratio of NTES (3.01) is better than 81.43% of its industry peers.
- A Quick Ratio of 3.00 indicates that NTES has no problem at all paying its short term obligations.
- With an excellent Quick ratio value of 3.00, NTES belongs to the best of the industry, outperforming 81.43% of the companies in the same industry.
Unpacking NASDAQ:NTES's Growth Rating
A key component of ChartMill's stock assessment is the Growth Rating, which spans from 0 to 10. This rating evaluates diverse growth factors, such as EPS and revenue growth, considering both past performance and future projections. NASDAQ:NTES has received a 6 out of 10:
- NTES shows a strong growth in Earnings Per Share. In the last year, the EPS has been growing by 12.67%, which is quite good.
- Measured over the past years, NTES shows a very strong growth in Earnings Per Share. The EPS has been growing by 39.56% on average per year.
- The Revenue has grown by 8.00% in the past year. This is quite good.
- The Revenue has been growing by 15.12% on average over the past years. This is quite good.
- Based on estimates for the next years, NTES will show a quite strong growth in Revenue. The Revenue will grow by 9.53% on average per year.
Our Decent Value screener lists more Decent Value stocks and is updated daily.
Our latest full fundamental report of NTES contains the most current fundamental analsysis.
Disclaimer
Important Note: The content of this article is not intended as trading advice. It is essential to perform your own analysis and exercise caution when making trading decisions. The article presents observations created by automated analysis but does not guarantee any trading or investment outcomes. Always trade responsibly and make independent judgments.