SERVICENOW INC (NYSE:NOW)—A High-Growth Stock Gearing Up for Its Next Upward Move.
By Mill Chart
Last update: Mar 21, 2025
Groth investors are looking for stocks showing high revenue and EPS growth. We will have a look here to see if SERVICENOW INC (NYSE:NOW) is suited for growth investing, while it is forming a base and may be ready to breakout. Investors should of course do their own research, but we spotted SERVICENOW INC showing up in our growth with base formation screen, so it may be worth spending some more time on it.
What does the Growth looks like for NOW
To evaluate a stock's growth potential, ChartMill utilizes a Growth Rating on a scale of 0 to 10. This comprehensive assessment considers various growth aspects, including historical and estimated EPS and revenue growth. NOW has achieved a 8 out of 10:
- The Earnings Per Share has grown by an impressive 29.34% over the past year.
- The Earnings Per Share has been growing by 33.14% on average over the past years. This is a very strong growth
- NOW shows a strong growth in Revenue. In the last year, the Revenue has grown by 22.44%.
- Measured over the past years, NOW shows a very strong growth in Revenue. The Revenue has been growing by 25.99% on average per year.
- Based on estimates for the next years, NOW will show a quite strong growth in Earnings Per Share. The EPS will grow by 18.77% on average per year.
- Based on estimates for the next years, NOW will show a quite strong growth in Revenue. The Revenue will grow by 18.69% on average per year.
Assessing Health Metrics for NOW
To gauge a stock's financial health, ChartMill utilizes a Health Rating on a scale of 0 to 10. This comprehensive evaluation encompasses liquidity and solvency, both in absolute terms and in comparison to industry peers. NOW has earned a 6 out of 10:
- NOW has an Altman-Z score of 10.50. This indicates that NOW is financially healthy and has little risk of bankruptcy at the moment.
- NOW has a better Altman-Z score (10.50) than 86.12% of its industry peers.
- NOW has a debt to FCF ratio of 0.44. This is a very positive value and a sign of high solvency as it would only need 0.44 years to pay back of all of its debts.
- With a decent Debt to FCF ratio value of 0.44, NOW is doing good in the industry, outperforming 76.51% of the companies in the same industry.
- A Debt/Equity ratio of 0.15 indicates that NOW is not too dependend on debt financing.
- NOW does not score too well on the current and quick ratio evaluation. However, as it has excellent solvency and profitability, these ratios do not necessarly indicate liquidity issues and need to be evaluated against the specifics of the business.
A Closer Look at Profitability for NOW
Discover ChartMill's exclusive Profitability Rating, a proprietary metric that assesses stocks on a scale of 0 to 10. It takes into consideration various profitability ratios and margins, both in absolute terms and relative to industry peers. Notably, NOW has achieved a 8:
- The Return On Assets of NOW (6.99%) is better than 80.43% of its industry peers.
- With an excellent Return On Equity value of 14.83%, NOW belongs to the best of the industry, outperforming 81.14% of the companies in the same industry.
- The Return On Invested Capital of NOW (9.30%) is better than 84.34% of its industry peers.
- The 3 year average ROIC (6.51%) for NOW is below the current ROIC(9.30%), indicating increased profibility in the last year.
- NOW has a better Profit Margin (12.97%) than 76.87% of its industry peers.
- NOW has a better Operating Margin (12.42%) than 80.78% of its industry peers.
- In the last couple of years the Operating Margin of NOW has grown nicely.
- With a decent Gross Margin value of 79.18%, NOW is doing good in the industry, outperforming 79.00% of the companies in the same industry.
How do we evaluate the setup for NOW?
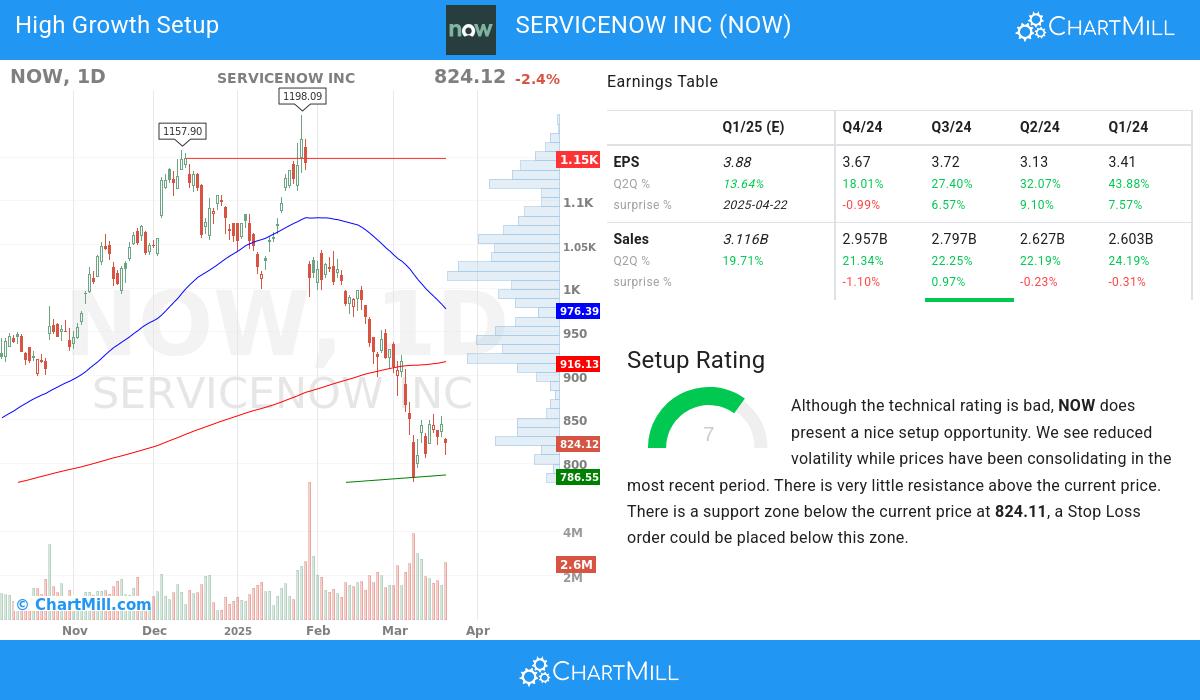
ChartMill provides a Setup Rating for each stock. This rating, ranging from 0 to 10, assesses the level of consolidation in the stock based on multiple short-term technical indicators. Currently, NOW has a 7 as its setup rating, indicating its current consolidation status.
Although the technical rating is bad, NOW does present a nice setup opportunity. Prices have been consolidating lately and the volatility has been reduced. There is very little resistance above the current price. There is a support zone below the current price at 824.11, a Stop Loss order could be placed below this zone.
More Strong Growth stocks can be found in our Strong Growth screener.
Check the latest full fundamental report of NOW for a complete fundamental analysis.
For an up to date full technical analysis you can check the technical report of NOW
Keep in mind
This article should in no way be interpreted as advice. The article is based on the observed metrics at the time of writing, but you should always make your own analysis and trade or invest at your own responsibility.
796.66
-19.84 (-2.43%)
Find more stocks in the Stock Screener
NOW Latest News and Analysis
 2 days ago - ChartmillWhy SERVICENOW INC (NYSE:NOW) Is a Standout High-Growth Stock in a Consolidation Phase.
Based on a technical and fundamental analysis of NYSE:NOW we conclude: SERVICENOW INC (NYSE:NOW)—A High-Growth Stock Gearing Up for Its Next Upward Move.
 14 days ago - ChartmillWhich S&P500 stocks are moving after the closing bell on Wednesday?
After the conclusion of the US market's regular session on Wednesday, let's examine the after-hours session and unveil the notable S&P500 performers among the top gainers and losers.
 16 days ago - ChartmillWhat's going on in today's session: S&P500 gap up and gap down stocks
Let's take a look at the S&P500 stocks that are experiencing notable price gaps in today's session on Monday. Discover the gap up and gap down stocks in the S&P500 index.
19 days ago - ChartmillTop gainers and losers in the S&P500 index during Friday's after-hours session.The regular session of the US market on Friday is now over, but let's get a preview of the after-hours session and explore the top S&P500 gainers and losers driving the post-market movements.
