
In this article we will dive into NETFLIX INC (NASDAQ:NFLX) as a possible candidate for growth investing. Investors should always do their own research, but we noticed NETFLIX INC showing up in our strong growth, ready to breakout screen, which makes it worth to investigate a bit more.
How We Gauge Growth for NASDAQ:NFLX
To evaluate a stock's growth potential, ChartMill utilizes a Growth Rating on a scale of 0 to 10. This comprehensive assessment considers various growth aspects, including historical and estimated EPS and revenue growth. NASDAQ:NFLX has achieved a 8 out of 10:
- NFLX shows a strong growth in Earnings Per Share. In the last year, the EPS has been growing by 70.39%, which is quite impressive.
- NFLX shows a strong growth in Earnings Per Share. Measured over the last years, the EPS has been growing by 34.98% yearly.
- NFLX shows quite a strong growth in Revenue. In the last year, the Revenue has grown by 13.00%.
- Measured over the past years, NFLX shows a quite strong growth in Revenue. The Revenue has been growing by 16.38% on average per year.
- The Earnings Per Share is expected to grow by 24.29% on average over the next years. This is a very strong growth
- Based on estimates for the next years, NFLX will show a quite strong growth in Revenue. The Revenue will grow by 10.95% on average per year.
Health Assessment of NASDAQ:NFLX
ChartMill employs a unique Health Rating system for all stocks. This rating, ranging from 0 to 10, is determined by analyzing various liquidity and solvency ratios. For NASDAQ:NFLX, the assigned 7 for health provides valuable insights:
- An Altman-Z score of 8.82 indicates that NFLX is not in any danger for bankruptcy at the moment.
- Looking at the Altman-Z score, with a value of 8.82, NFLX belongs to the top of the industry, outperforming 98.57% of the companies in the same industry.
- NFLX has a debt to FCF ratio of 2.05. This is a good value and a sign of high solvency as NFLX would need 2.05 years to pay back of all of its debts.
- The Debt to FCF ratio of NFLX (2.05) is better than 85.71% of its industry peers.
- Even though the debt/equity ratio score it not favorable for NFLX, it has very limited outstanding debt, so we won't put too much weight on the DE evaluation.
- The current and quick ratio evaluation for NFLX is rather negative, while it does have excellent solvency and profitability. These ratios do not necessarly indicate liquidity issues and need to be evaluated against the specifics of the business.
Evaluating Profitability: NASDAQ:NFLX
ChartMill employs its own Profitability Rating system for stock evaluation. This score, ranging from 0 to 10, is derived from an analysis of diverse profitability metrics and margins. In the case of NASDAQ:NFLX, the assigned 9 is noteworthy for profitability:
- With an excellent Return On Assets value of 14.45%, NFLX belongs to the best of the industry, outperforming 92.86% of the companies in the same industry.
- NFLX's Return On Equity of 32.08% is amongst the best of the industry. NFLX outperforms 94.29% of its industry peers.
- The Return On Invested Capital of NFLX (18.37%) is better than 97.14% of its industry peers.
- The Average Return On Invested Capital over the past 3 years for NFLX is above the industry average of 9.64%.
- The 3 year average ROIC (13.36%) for NFLX is below the current ROIC(18.37%), indicating increased profibility in the last year.
- The Profit Margin of NFLX (19.54%) is better than 94.29% of its industry peers.
- In the last couple of years the Profit Margin of NFLX has grown nicely.
- Looking at the Operating Margin, with a value of 23.82%, NFLX belongs to the top of the industry, outperforming 94.29% of the companies in the same industry.
- NFLX's Operating Margin has improved in the last couple of years.
- NFLX's Gross Margin has improved in the last couple of years.
Why is NASDAQ:NFLX a setup?
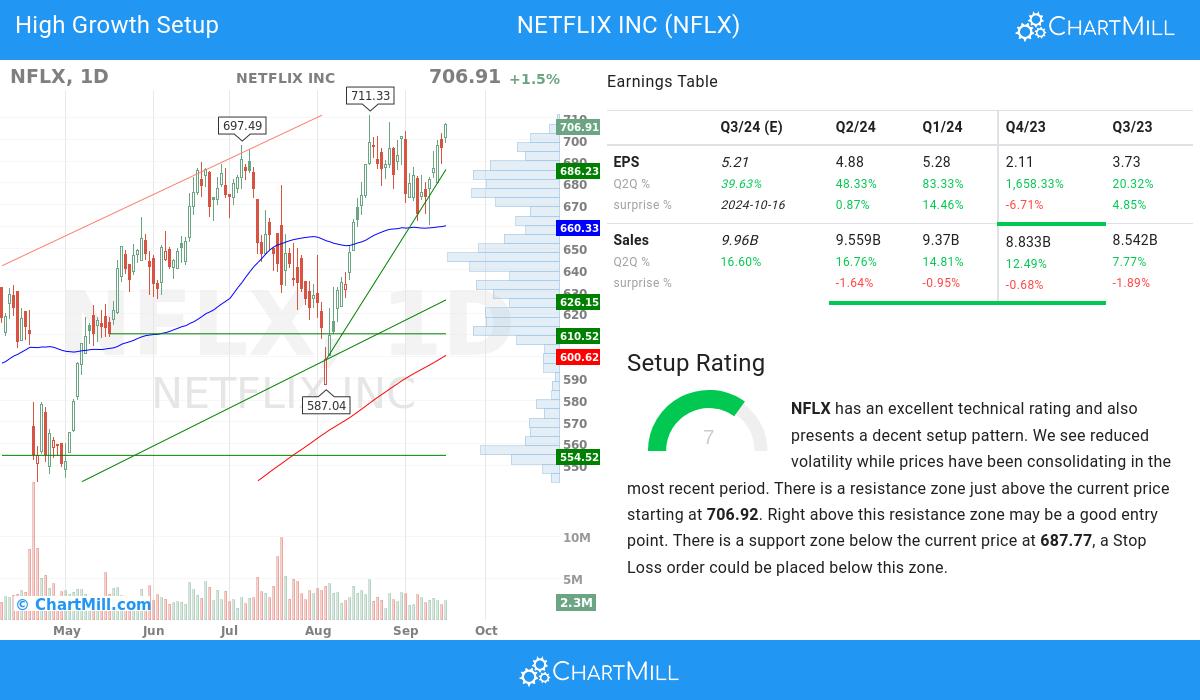
Besides the Technical Rating, ChartMill assigns a Setup Rating to every stock to determine the degree of consolidation. This rating, ranging from 0 to 10, is updated daily and evaluates various short-term technical indicators. NASDAQ:NFLX currently holds a 7 as its setup rating, suggesting a particular level of consolidation in the stock.
NFLX has an excellent technical rating and also presents a decent setup pattern. We see reduced volatility while prices have been consolidating in the most recent period. There is a resistance zone just above the current price starting at 706.92. Right above this resistance zone may be a good entry point. There is a support zone below the current price at 687.77, a Stop Loss order could be placed below this zone.
Our Strong Growth screener lists more Strong Growth stocks and is updated daily.
For an up to date full fundamental analysis you can check the fundamental report of NFLX
Our latest full technical report of NFLX contains the most current technical analsysis.
Keep in mind
This is not investing advice! The article highlights some of the observations at the time of writing, but you should always make your own analysis and invest based on your own insights.