
Uncover the potential of NETFLIX INC (NASDAQ:NFLX), a growth stock that our stock screener found to be reasonably priced. NASDAQ:NFLX is excelling in growth aspects, maintaining a healthy financial position, and still offers an attractive valuation. We'll examine each aspect in detail.
Assessing Growth for NASDAQ:NFLX
ChartMill employs its own Growth Rating system for all stocks. This score, ranging from 0 to 10, is derived by evaluating different growth factors, such as EPS and revenue growth, taking into account both past performance and future projections. NASDAQ:NFLX has earned a 8 for growth:
- NFLX shows a strong growth in Earnings Per Share. In the last year, the EPS has been growing by 70.39%, which is quite impressive.
- Measured over the past years, NFLX shows a very strong growth in Earnings Per Share. The EPS has been growing by 34.98% on average per year.
- The Revenue has grown by 13.00% in the past year. This is quite good.
- Measured over the past years, NFLX shows a quite strong growth in Revenue. The Revenue has been growing by 16.38% on average per year.
- The Earnings Per Share is expected to grow by 24.29% on average over the next years. This is a very strong growth
- The Revenue is expected to grow by 10.95% on average over the next years. This is quite good.
Understanding NASDAQ:NFLX's Valuation Score
To assess a stock's valuation, ChartMill utilizes a Valuation Rating on a scale of 0 to 10. This comprehensive assessment considers various valuation aspects, comparing price to earnings and cash flows, while factoring in profitability and growth. NASDAQ:NFLX has achieved a 5 out of 10:
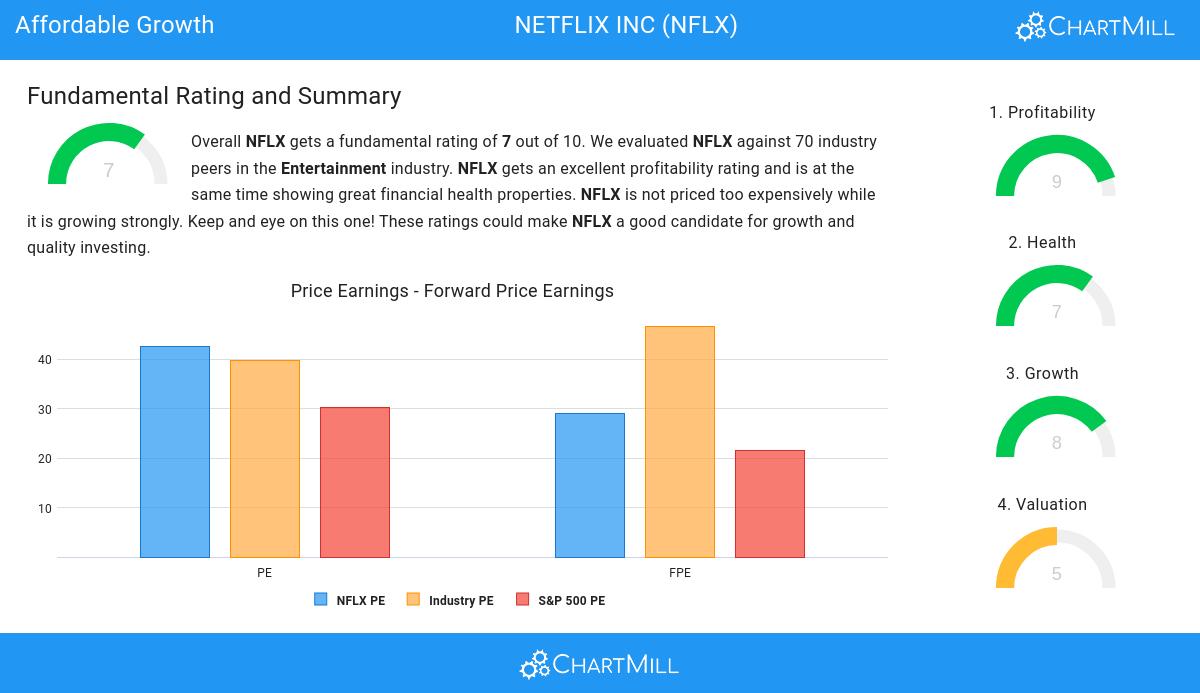
- Compared to the rest of the industry, the Price/Earnings ratio of NFLX indicates a somewhat cheap valuation: NFLX is cheaper than 71.43% of the companies listed in the same industry.
- Based on the Price/Forward Earnings ratio, NFLX is valued a bit cheaper than 68.57% of the companies in the same industry.
- 67.14% of the companies in the same industry are more expensive than NFLX, based on the Enterprise Value to EBITDA ratio.
- Compared to the rest of the industry, the Price/Free Cash Flow ratio of NFLX indicates a somewhat cheap valuation: NFLX is cheaper than 70.00% of the companies listed in the same industry.
- NFLX's low PEG Ratio(NY), which compensates the Price/Earnings for growth, indicates a rather cheap valuation of the company.
- NFLX has an outstanding profitability rating, which may justify a higher PE ratio.
- A more expensive valuation may be justified as NFLX's earnings are expected to grow with 32.56% in the coming years.
Understanding NASDAQ:NFLX's Health Score
Every stock is evaluated by ChartMill, receiving a Health Rating on a scale of 0 to 10. This assessment considers different health aspects, including liquidity and solvency, both in absolute terms and relative to industry peers. NASDAQ:NFLX has achieved a 7 out of 10:
- NFLX has an Altman-Z score of 8.59. This indicates that NFLX is financially healthy and has little risk of bankruptcy at the moment.
- NFLX has a Altman-Z score of 8.59. This is amongst the best in the industry. NFLX outperforms 98.57% of its industry peers.
- The Debt to FCF ratio of NFLX is 2.05, which is a good value as it means it would take NFLX, 2.05 years of fcf income to pay off all of its debts.
- NFLX has a better Debt to FCF ratio (2.05) than 85.71% of its industry peers.
- Although NFLX does not score too well on debt/equity it has very limited outstanding debt, which is well covered by the FCF. We will not put too much weight on the debt/equity number as it may be because of low equity, which could be a consequence of a share buyback program for instance. This needs to be investigated.
- NFLX does not score too well on the current and quick ratio evaluation. However, as it has excellent solvency and profitability, these ratios do not necessarly indicate liquidity issues and need to be evaluated against the specifics of the business.
Profitability Assessment of NASDAQ:NFLX
ChartMill's Profitability Rating offers a unique perspective on stock analysis, providing scores from 0 to 10. These ratings consider a wide range of profitability metrics and margins, both in comparison to industry peers and on their own merits. For NASDAQ:NFLX, the assigned 9 is a significant indicator of profitability:
- NFLX has a Return On Assets of 14.45%. This is amongst the best in the industry. NFLX outperforms 92.86% of its industry peers.
- NFLX has a better Return On Equity (32.08%) than 94.29% of its industry peers.
- The Return On Invested Capital of NFLX (18.37%) is better than 97.14% of its industry peers.
- The Average Return On Invested Capital over the past 3 years for NFLX is above the industry average of 9.89%.
- The last Return On Invested Capital (18.37%) for NFLX is above the 3 year average (13.36%), which is a sign of increasing profitability.
- NFLX has a Profit Margin of 19.54%. This is amongst the best in the industry. NFLX outperforms 94.29% of its industry peers.
- In the last couple of years the Profit Margin of NFLX has grown nicely.
- Looking at the Operating Margin, with a value of 23.82%, NFLX belongs to the top of the industry, outperforming 94.29% of the companies in the same industry.
- NFLX's Operating Margin has improved in the last couple of years.
- In the last couple of years the Gross Margin of NFLX has grown nicely.
Every day, new Affordable Growth stocks can be found on ChartMill in our Affordable Growth screener.
Our latest full fundamental report of NFLX contains the most current fundamental analsysis.
Keep in mind
This is not investing advice! The article highlights some of the observations at the time of writing, but you should always make your own analysis and invest based on your own insights.