
Looking for growth without the hefty price tag? Consider NASDAQ:NBIX.
By Mill Chart
Last update: Feb 5, 2025
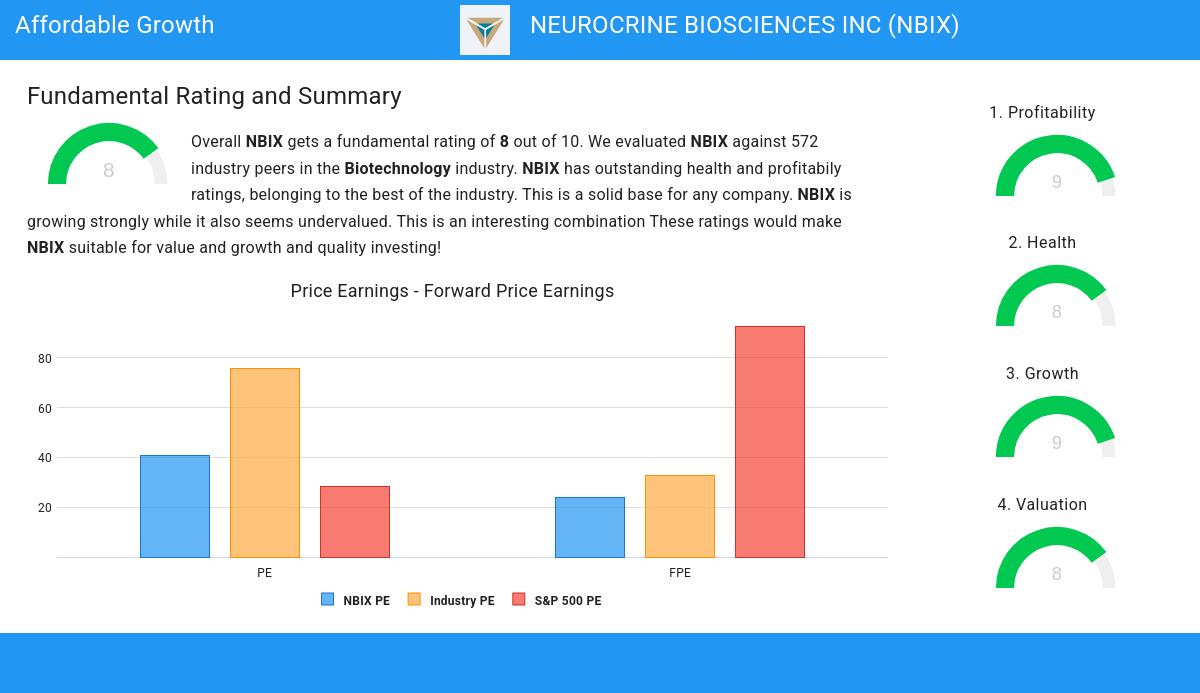
NEUROCRINE BIOSCIENCES INC (NASDAQ:NBIX) has caught the eye of our stock screener as an affordable growth stock. NASDAQ:NBIX is displaying robust growth metrics and also excels in terms of profitability, solvency, and liquidity. Additionally, it appears to be reasonably priced. Let's delve into the details.
Evaluating Growth: NASDAQ:NBIX
ChartMill assigns a Growth Rating to each stock, ranging from 0 to 10. This rating is determined by analyzing different growth elements, including EPS and revenue growth, spanning both historical and future figures. In the case of NASDAQ:NBIX, the assigned 9 reflects its growth potential:
- The Earnings Per Share has grown by an impressive 100.54% over the past year.
- Measured over the past years, NBIX shows a very strong growth in Earnings Per Share. The EPS has been growing by 70.09% on average per year.
- The Revenue has grown by 25.72% in the past year. This is a very strong growth!
- NBIX shows a strong growth in Revenue. Measured over the last years, the Revenue has been growing by 33.13% yearly.
- Based on estimates for the next years, NBIX will show a very strong growth in Earnings Per Share. The EPS will grow by 48.01% on average per year.
- The Revenue is expected to grow by 17.44% on average over the next years. This is quite good.
Valuation Assessment of NASDAQ:NBIX
ChartMill assigns a Valuation Rating to every stock. This score ranges from 0 to 10 and evaluates the different valuation aspects and compares the price to earnings and cash flows, while taking into account profitability and growth. NASDAQ:NBIX scores a 8 out of 10:
- Based on the Price/Earnings ratio, NBIX is valued cheaply inside the industry as 94.34% of the companies are valued more expensively.
- 93.98% of the companies in the same industry are more expensive than NBIX, based on the Price/Forward Earnings ratio.
- The average S&P500 Price/Forward Earnings ratio is at 92.74. NBIX is valued rather cheaply when compared to this.
- NBIX's Enterprise Value to EBITDA ratio is rather cheap when compared to the industry. NBIX is cheaper than 95.40% of the companies in the same industry.
- 95.22% of the companies in the same industry are more expensive than NBIX, based on the Price/Free Cash Flow ratio.
- The low PEG Ratio(NY), which compensates the Price/Earnings for growth, indicates a rather cheap valuation of the company.
- NBIX has an outstanding profitability rating, which may justify a higher PE ratio.
- A more expensive valuation may be justified as NBIX's earnings are expected to grow with 55.15% in the coming years.
Exploring NASDAQ:NBIX's Health
ChartMill employs its own Health Rating for stock assessment. This rating, ranging from 0 to 10, is calculated by examining various liquidity and solvency ratios. In the case of NASDAQ:NBIX, the assigned 8 reflects its health status:
- An Altman-Z score of 13.05 indicates that NBIX is not in any danger for bankruptcy at the moment.
- NBIX has a better Altman-Z score (13.05) than 88.32% of its industry peers.
- NBIX has no outstanding debt. Therefor its Debt/Equity and Debt/FCF ratios are 0 and belong to the best of the industry.
- NBIX has a Current Ratio of 4.37. This indicates that NBIX is financially healthy and has no problem in meeting its short term obligations.
- A Quick Ratio of 4.26 indicates that NBIX has no problem at all paying its short term obligations.
Assessing Profitability for NASDAQ:NBIX
ChartMill's Profitability Rating offers a unique perspective on stock analysis, providing scores from 0 to 10. These ratings consider a wide range of profitability metrics and margins, both in comparison to industry peers and on their own merits. For NASDAQ:NBIX, the assigned 9 is a significant indicator of profitability:
- NBIX has a Return On Assets of 10.92%. This is amongst the best in the industry. NBIX outperforms 96.46% of its industry peers.
- Looking at the Return On Equity, with a value of 14.19%, NBIX belongs to the top of the industry, outperforming 96.28% of the companies in the same industry.
- The Return On Invested Capital of NBIX (13.96%) is better than 96.81% of its industry peers.
- The last Return On Invested Capital (13.96%) for NBIX is above the 3 year average (9.89%), which is a sign of increasing profitability.
- NBIX's Profit Margin of 17.21% is amongst the best of the industry. NBIX outperforms 96.46% of its industry peers.
- NBIX's Profit Margin has improved in the last couple of years.
- NBIX's Operating Margin of 26.23% is amongst the best of the industry. NBIX outperforms 97.17% of its industry peers.
- NBIX's Operating Margin has improved in the last couple of years.
- Looking at the Gross Margin, with a value of 98.52%, NBIX belongs to the top of the industry, outperforming 97.70% of the companies in the same industry.
More Affordable Growth stocks can be found in our Affordable Growth screener.
Our latest full fundamental report of NBIX contains the most current fundamental analsysis.
Keep in mind
This is not investing advice! The article highlights some of the observations at the time of writing, but you should always make your own analysis and invest based on your own insights.