
NASDAQ:NBIX appears to be flying under the radar despite its strong fundamentals.
By Mill Chart
Last update: Oct 21, 2024
Consider NEUROCRINE BIOSCIENCES INC (NASDAQ:NBIX) as a top value stock, identified by our stock screening tool. NASDAQ:NBIX shines in terms of profitability, solvency, and liquidity, all while remaining very reasonably priced. Let's dive deeper into the analysis.
Valuation Examination for NASDAQ:NBIX
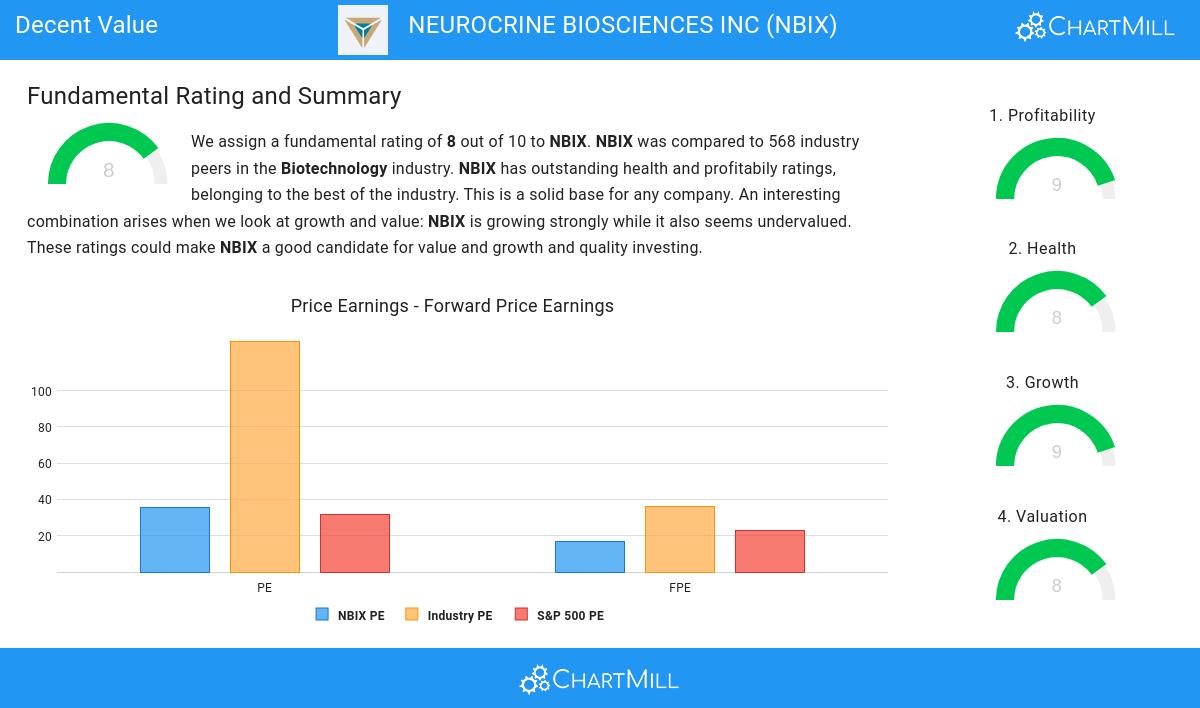
ChartMill assigns a proprietary Valuation Rating to each stock. The score is computed by evaluating various valuation aspects, like price to earnings and free cash flow, both absolutely as relative to the market and industry. NASDAQ:NBIX was assigned a score of 8 for valuation:
- Based on the Price/Earnings ratio, NBIX is valued cheaper than 95.38% of the companies in the same industry.
- NBIX's Price/Forward Earnings ratio is rather cheap when compared to the industry. NBIX is cheaper than 96.09% of the companies in the same industry.
- Compared to an average S&P500 Price/Forward Earnings ratio of 22.81, NBIX is valued a bit cheaper.
- Based on the Enterprise Value to EBITDA ratio, NBIX is valued cheaply inside the industry as 95.91% of the companies are valued more expensively.
- Based on the Price/Free Cash Flow ratio, NBIX is valued cheaper than 96.63% of the companies in the same industry.
- The low PEG Ratio(NY), which compensates the Price/Earnings for growth, indicates a rather cheap valuation of the company.
- The excellent profitability rating of NBIX may justify a higher PE ratio.
- NBIX's earnings are expected to grow with 57.66% in the coming years. This may justify a more expensive valuation.
Understanding NASDAQ:NBIX's Profitability
ChartMill employs its own Profitability Rating system for stock evaluation. This score, ranging from 0 to 10, is derived from an analysis of diverse profitability metrics and margins. In the case of NASDAQ:NBIX, the assigned 9 is noteworthy for profitability:
- The Return On Assets of NBIX (10.26%) is better than 96.63% of its industry peers.
- NBIX's Return On Equity of 13.52% is amongst the best of the industry. NBIX outperforms 96.09% of its industry peers.
- NBIX has a Return On Invested Capital of 13.81%. This is amongst the best in the industry. NBIX outperforms 96.80% of its industry peers.
- The 3 year average ROIC (9.89%) for NBIX is below the current ROIC(13.81%), indicating increased profibility in the last year.
- Looking at the Profit Margin, with a value of 16.00%, NBIX belongs to the top of the industry, outperforming 96.63% of the companies in the same industry.
- In the last couple of years the Profit Margin of NBIX has grown nicely.
- NBIX has a Operating Margin of 25.70%. This is amongst the best in the industry. NBIX outperforms 97.69% of its industry peers.
- NBIX's Operating Margin has improved in the last couple of years.
- NBIX's Gross Margin of 98.28% is amongst the best of the industry. NBIX outperforms 97.69% of its industry peers.
Exploring NASDAQ:NBIX's Health
ChartMill assigns a Health Rating to every stock. This score ranges from 0 to 10 and evaluates the different health aspects like liquidity and solvency, both absolutely, but also relative to the industry peers. NASDAQ:NBIX scores a 8 out of 10:
- NBIX has an Altman-Z score of 10.61. This indicates that NBIX is financially healthy and has little risk of bankruptcy at the moment.
- NBIX has a better Altman-Z score (10.61) than 85.79% of its industry peers.
- NBIX has no outstanding debt. Therefor its Debt/Equity and Debt/FCF ratios are 0 and belong to the best of the industry.
- NBIX has a Current Ratio of 4.19. This indicates that NBIX is financially healthy and has no problem in meeting its short term obligations.
- A Quick Ratio of 4.08 indicates that NBIX has no problem at all paying its short term obligations.
A Closer Look at Growth for NASDAQ:NBIX
Every stock receives a Growth Rating from ChartMill, ranging from 0 to 10. This rating assesses various growth aspects, including historical and projected EPS and revenue growth. NASDAQ:NBIX boasts a 9 out of 10:
- NBIX shows a strong growth in Earnings Per Share. In the last year, the EPS has been growing by 91.33%, which is quite impressive.
- Measured over the past years, NBIX shows a very strong growth in Earnings Per Share. The EPS has been growing by 70.09% on average per year.
- Looking at the last year, NBIX shows a very strong growth in Revenue. The Revenue has grown by 26.69%.
- NBIX shows a strong growth in Revenue. Measured over the last years, the Revenue has been growing by 33.13% yearly.
- Based on estimates for the next years, NBIX will show a very strong growth in Earnings Per Share. The EPS will grow by 44.72% on average per year.
- The Revenue is expected to grow by 15.24% on average over the next years. This is quite good.
Every day, new Decent Value stocks can be found on ChartMill in our Decent Value screener.
Our latest full fundamental report of NBIX contains the most current fundamental analsysis.
Disclaimer
This article should in no way be interpreted as advice. The article is based on the observed metrics at the time of writing, but you should always make your own analysis and trade or invest at your own responsibility.
NASDAQ:NBIX (12/17/2025, 3:07:30 PM)
142.78
-5.96 (-4.01%)
Find more stocks in the Stock Screener
NBIX Latest News and Analysis


