
Despite its growth, NASDAQ:NBIX remains within the realm of affordability.
By Mill Chart
Last update: Sep 30, 2024
NEUROCRINE BIOSCIENCES INC (NASDAQ:NBIX) was identified as an affordable growth stock by our stock screener. NASDAQ:NBIX is showing great growth, but also scores well on profitability, solvency and liquidity. At the same time it seems to be priced reasonably. We'll explore this a bit deeper below.
A Closer Look at Growth for NASDAQ:NBIX
ChartMill assigns a Growth Rating to every stock. This score ranges from 0 to 10 and evaluates the different growth aspects like EPS and Revenue, both in the past as in the future. NASDAQ:NBIX scores a 9 out of 10:
- The Earnings Per Share has grown by an impressive 91.33% over the past year.
- NBIX shows a strong growth in Earnings Per Share. Measured over the last years, the EPS has been growing by 70.09% yearly.
- NBIX shows a strong growth in Revenue. In the last year, the Revenue has grown by 26.69%.
- The Revenue has been growing by 33.13% on average over the past years. This is a very strong growth!
- NBIX is expected to show a strong growth in Earnings Per Share. In the coming years, the EPS will grow by 44.72% yearly.
- NBIX is expected to show quite a strong growth in Revenue. In the coming years, the Revenue will grow by 15.24% yearly.
Valuation Assessment of NASDAQ:NBIX
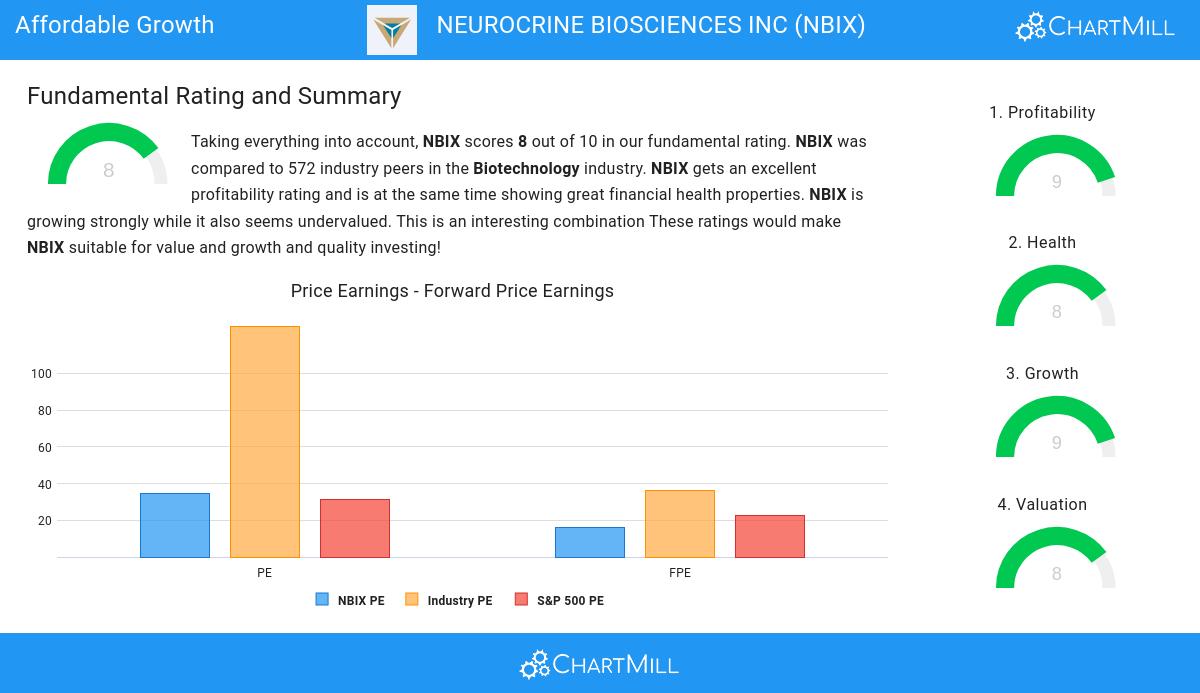
ChartMill assigns a Valuation Rating to each stock, ranging from 0 to 10. This rating is calculated by analyzing different valuation elements, such as price to earnings and free cash flow, both in absolute terms and relative to the market and industry. In the case of NASDAQ:NBIX, the assigned 8 reflects its valuation:
- Based on the Price/Earnings ratio, NBIX is valued cheaper than 95.41% of the companies in the same industry.
- NBIX's Price/Forward Earnings ratio is rather cheap when compared to the industry. NBIX is cheaper than 96.11% of the companies in the same industry.
- The average S&P500 Price/Forward Earnings ratio is at 22.50. NBIX is valued slightly cheaper when compared to this.
- 95.58% of the companies in the same industry are more expensive than NBIX, based on the Enterprise Value to EBITDA ratio.
- Based on the Price/Free Cash Flow ratio, NBIX is valued cheaply inside the industry as 96.64% of the companies are valued more expensively.
- NBIX's low PEG Ratio(NY), which compensates the Price/Earnings for growth, indicates a rather cheap valuation of the company.
- The excellent profitability rating of NBIX may justify a higher PE ratio.
- A more expensive valuation may be justified as NBIX's earnings are expected to grow with 57.66% in the coming years.
Health Assessment of NASDAQ:NBIX
ChartMill utilizes a Health Rating to assess stocks, scoring them on a scale of 0 to 10. This rating takes into account a variety of liquidity and solvency ratios, both in absolute terms and in comparison to industry peers. NASDAQ:NBIX has earned a 8 out of 10:
- An Altman-Z score of 10.39 indicates that NBIX is not in any danger for bankruptcy at the moment.
- The Altman-Z score of NBIX (10.39) is better than 86.22% of its industry peers.
- NBIX has no outstanding debt. Therefor its Debt/Equity and Debt/FCF ratios are 0 and belong to the best of the industry.
- A Current Ratio of 4.19 indicates that NBIX has no problem at all paying its short term obligations.
- NBIX has a Quick Ratio of 4.08. This indicates that NBIX is financially healthy and has no problem in meeting its short term obligations.
A Closer Look at Profitability for NASDAQ:NBIX
ChartMill assigns a Profitability Rating to every stock. This score ranges from 0 to 10 and evaluates the different profitability ratios and margins, both absolutely, but also relative to the industry peers. NASDAQ:NBIX scores a 9 out of 10:
- The Return On Assets of NBIX (10.26%) is better than 96.82% of its industry peers.
- The Return On Equity of NBIX (13.52%) is better than 96.29% of its industry peers.
- NBIX has a Return On Invested Capital of 13.81%. This is amongst the best in the industry. NBIX outperforms 96.82% of its industry peers.
- The last Return On Invested Capital (13.81%) for NBIX is above the 3 year average (9.89%), which is a sign of increasing profitability.
- NBIX's Profit Margin of 16.00% is amongst the best of the industry. NBIX outperforms 96.82% of its industry peers.
- NBIX's Profit Margin has improved in the last couple of years.
- The Operating Margin of NBIX (25.70%) is better than 97.70% of its industry peers.
- In the last couple of years the Operating Margin of NBIX has grown nicely.
- With an excellent Gross Margin value of 98.28%, NBIX belongs to the best of the industry, outperforming 97.53% of the companies in the same industry.
Our Affordable Growth screener lists more Affordable Growth stocks and is updated daily.
Our latest full fundamental report of NBIX contains the most current fundamental analsysis.
Keep in mind
Important Note: The content of this article is not intended as trading advice. It is essential to perform your own analysis and exercise caution when making trading decisions. The article presents observations created by automated analysis but does not guarantee any trading or investment outcomes. Always trade responsibly and make independent judgments.