
For those who appreciate value investing, NASDAQ:NBIX is a compelling option with its solid fundamentals.
By Mill Chart
Last update: Sep 26, 2024
NEUROCRINE BIOSCIENCES INC (NASDAQ:NBIX) is a hidden gem identified by our stock screening tool, featuring undervaluation and robust fundamentals. NASDAQ:NBIX showcases decent financial health and profitability, coupled with an attractive price. Let's dig deeper into the analysis.
Assessing Valuation Metrics for NASDAQ:NBIX
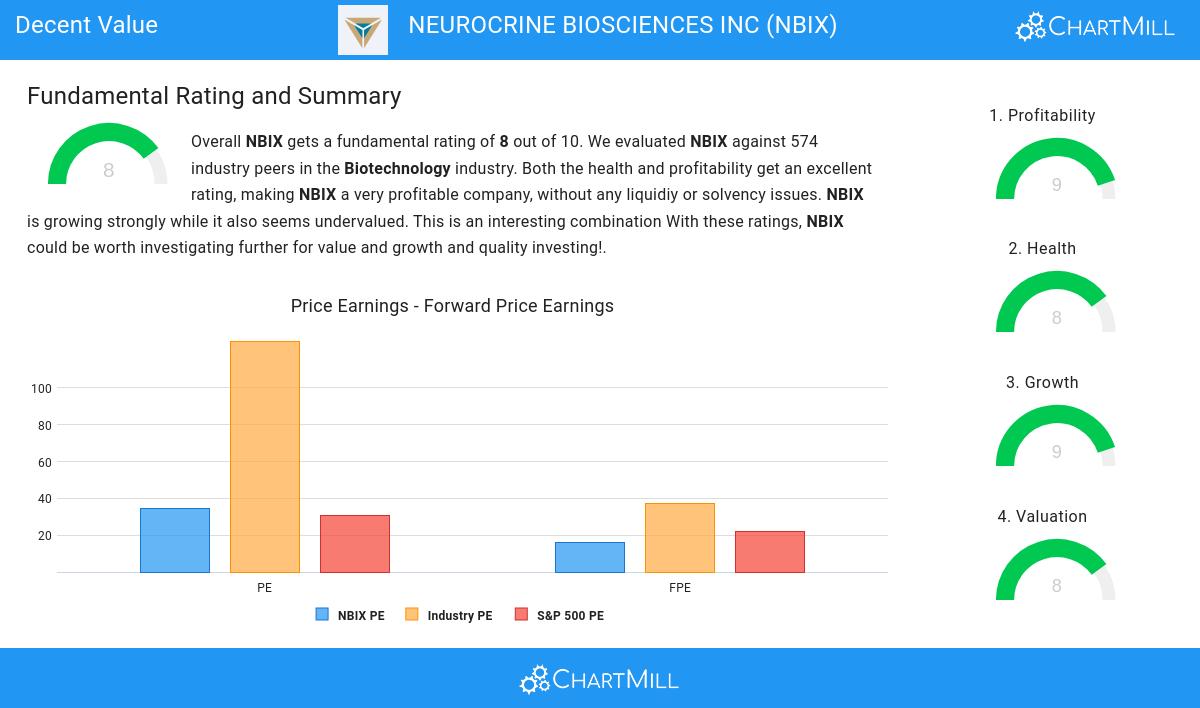
To assess a stock's valuation, ChartMill utilizes a Valuation Rating on a scale of 0 to 10. This comprehensive assessment considers various valuation aspects, comparing price to earnings and cash flows, while factoring in profitability and growth. NASDAQ:NBIX has achieved a 8 out of 10:
- 95.42% of the companies in the same industry are more expensive than NBIX, based on the Price/Earnings ratio.
- Based on the Price/Forward Earnings ratio, NBIX is valued cheaply inside the industry as 95.95% of the companies are valued more expensively.
- NBIX is valuated rather cheaply when we compare the Price/Forward Earnings ratio to 22.19, which is the current average of the S&P500 Index.
- 95.60% of the companies in the same industry are more expensive than NBIX, based on the Enterprise Value to EBITDA ratio.
- 96.83% of the companies in the same industry are more expensive than NBIX, based on the Price/Free Cash Flow ratio.
- NBIX's low PEG Ratio(NY), which compensates the Price/Earnings for growth, indicates a rather cheap valuation of the company.
- The excellent profitability rating of NBIX may justify a higher PE ratio.
- NBIX's earnings are expected to grow with 57.66% in the coming years. This may justify a more expensive valuation.
A Closer Look at Profitability for NASDAQ:NBIX
ChartMill employs its own Profitability Rating system for stock evaluation. This score, ranging from 0 to 10, is derived from an analysis of diverse profitability metrics and margins. In the case of NASDAQ:NBIX, the assigned 9 is noteworthy for profitability:
- The Return On Assets of NBIX (10.26%) is better than 96.83% of its industry peers.
- The Return On Equity of NBIX (13.52%) is better than 96.30% of its industry peers.
- NBIX's Return On Invested Capital of 13.81% is amongst the best of the industry. NBIX outperforms 96.83% of its industry peers.
- The last Return On Invested Capital (13.81%) for NBIX is above the 3 year average (9.89%), which is a sign of increasing profitability.
- NBIX has a better Profit Margin (16.00%) than 96.83% of its industry peers.
- NBIX's Profit Margin has improved in the last couple of years.
- With an excellent Operating Margin value of 25.70%, NBIX belongs to the best of the industry, outperforming 97.71% of the companies in the same industry.
- NBIX's Operating Margin has improved in the last couple of years.
- NBIX's Gross Margin of 98.28% is amongst the best of the industry. NBIX outperforms 97.71% of its industry peers.
Health Assessment of NASDAQ:NBIX
ChartMill employs a unique Health Rating system for all stocks. This rating, ranging from 0 to 10, is determined by analyzing various liquidity and solvency ratios. For NASDAQ:NBIX, the assigned 8 for health provides valuable insights:
- An Altman-Z score of 10.35 indicates that NBIX is not in any danger for bankruptcy at the moment.
- The Altman-Z score of NBIX (10.35) is better than 86.62% of its industry peers.
- NBIX has no outstanding debt. Therefor its Debt/Equity and Debt/FCF ratios are 0 and belong to the best of the industry.
- NBIX has a Current Ratio of 4.19. This indicates that NBIX is financially healthy and has no problem in meeting its short term obligations.
- NBIX has a Quick Ratio of 4.08. This indicates that NBIX is financially healthy and has no problem in meeting its short term obligations.
Evaluating Growth: NASDAQ:NBIX
To evaluate a stock's growth potential, ChartMill utilizes a Growth Rating on a scale of 0 to 10. This comprehensive assessment considers various growth aspects, including historical and estimated EPS and revenue growth. NASDAQ:NBIX has achieved a 9 out of 10:
- NBIX shows a strong growth in Earnings Per Share. In the last year, the EPS has been growing by 91.33%, which is quite impressive.
- Measured over the past years, NBIX shows a very strong growth in Earnings Per Share. The EPS has been growing by 70.09% on average per year.
- NBIX shows a strong growth in Revenue. In the last year, the Revenue has grown by 26.69%.
- NBIX shows a strong growth in Revenue. Measured over the last years, the Revenue has been growing by 33.13% yearly.
- Based on estimates for the next years, NBIX will show a very strong growth in Earnings Per Share. The EPS will grow by 44.72% on average per year.
- NBIX is expected to show quite a strong growth in Revenue. In the coming years, the Revenue will grow by 15.24% yearly.
Every day, new Decent Value stocks can be found on ChartMill in our Decent Value screener.
Check the latest full fundamental report of NBIX for a complete fundamental analysis.
Keep in mind
This is not investing advice! The article highlights some of the observations at the time of writing, but you should always make your own analysis and invest based on your own insights.