
NASDAQ:NBIX—A High-Growth Stock Gearing Up for Its Next Upward Move.
By Mill Chart
Last update: Sep 19, 2024
Groth investors are looking for stocks showing high revenue and EPS growth. We will have a look here to see if NEUROCRINE BIOSCIENCES INC (NASDAQ:NBIX) is suited for growth investing, while it is forming a base and may be ready to breakout. Investors should of course do their own research, but we spotted NEUROCRINE BIOSCIENCES INC showing up in our growth with base formation screen, so it may be worth spending some more time on it.
Unpacking NASDAQ:NBIX's Growth Rating
ChartMill employs its own Growth Rating system for all stocks. This score, ranging from 0 to 10, is derived by evaluating different growth factors, such as EPS and revenue growth, taking into account both past performance and future projections. NASDAQ:NBIX has earned a 9 for growth:
- The Earnings Per Share has grown by an impressive 91.33% over the past year.
- The Earnings Per Share has been growing by 70.09% on average over the past years. This is a very strong growth
- The Revenue has grown by 26.69% in the past year. This is a very strong growth!
- NBIX shows a strong growth in Revenue. Measured over the last years, the Revenue has been growing by 33.13% yearly.
- Based on estimates for the next years, NBIX will show a very strong growth in Earnings Per Share. The EPS will grow by 44.72% on average per year.
- NBIX is expected to show quite a strong growth in Revenue. In the coming years, the Revenue will grow by 15.24% yearly.
Health Assessment of NASDAQ:NBIX
ChartMill assigns a proprietary Health Rating to each stock. The score is computed by evaluating various liquidity and solvency ratios and ranges from 0 to 10. NASDAQ:NBIX was assigned a score of 8 for health:
- An Altman-Z score of 10.75 indicates that NBIX is not in any danger for bankruptcy at the moment.
- Looking at the Altman-Z score, with a value of 10.75, NBIX belongs to the top of the industry, outperforming 85.74% of the companies in the same industry.
- NBIX has no outstanding debt. Therefor its Debt/Equity and Debt/FCF ratios are 0 and belong to the best of the industry.
- A Current Ratio of 4.19 indicates that NBIX has no problem at all paying its short term obligations.
- A Quick Ratio of 4.08 indicates that NBIX has no problem at all paying its short term obligations.
Looking at the Profitability
ChartMill assigns a Profitability Rating to every stock. This score ranges from 0 to 10 and evaluates the different profitability ratios and margins, both absolutely, but also relative to the industry peers. NASDAQ:NBIX scores a 9 out of 10:
- NBIX has a Return On Assets of 10.26%. This is amongst the best in the industry. NBIX outperforms 97.01% of its industry peers.
- With an excellent Return On Equity value of 13.52%, NBIX belongs to the best of the industry, outperforming 96.48% of the companies in the same industry.
- With an excellent Return On Invested Capital value of 13.81%, NBIX belongs to the best of the industry, outperforming 96.83% of the companies in the same industry.
- The 3 year average ROIC (9.89%) for NBIX is below the current ROIC(13.81%), indicating increased profibility in the last year.
- NBIX has a better Profit Margin (16.00%) than 97.01% of its industry peers.
- In the last couple of years the Profit Margin of NBIX has grown nicely.
- Looking at the Operating Margin, with a value of 25.70%, NBIX belongs to the top of the industry, outperforming 97.89% of the companies in the same industry.
- NBIX's Operating Margin has improved in the last couple of years.
- NBIX's Gross Margin of 98.28% is amongst the best of the industry. NBIX outperforms 97.71% of its industry peers.
How do we evaluate the setup for NASDAQ:NBIX?
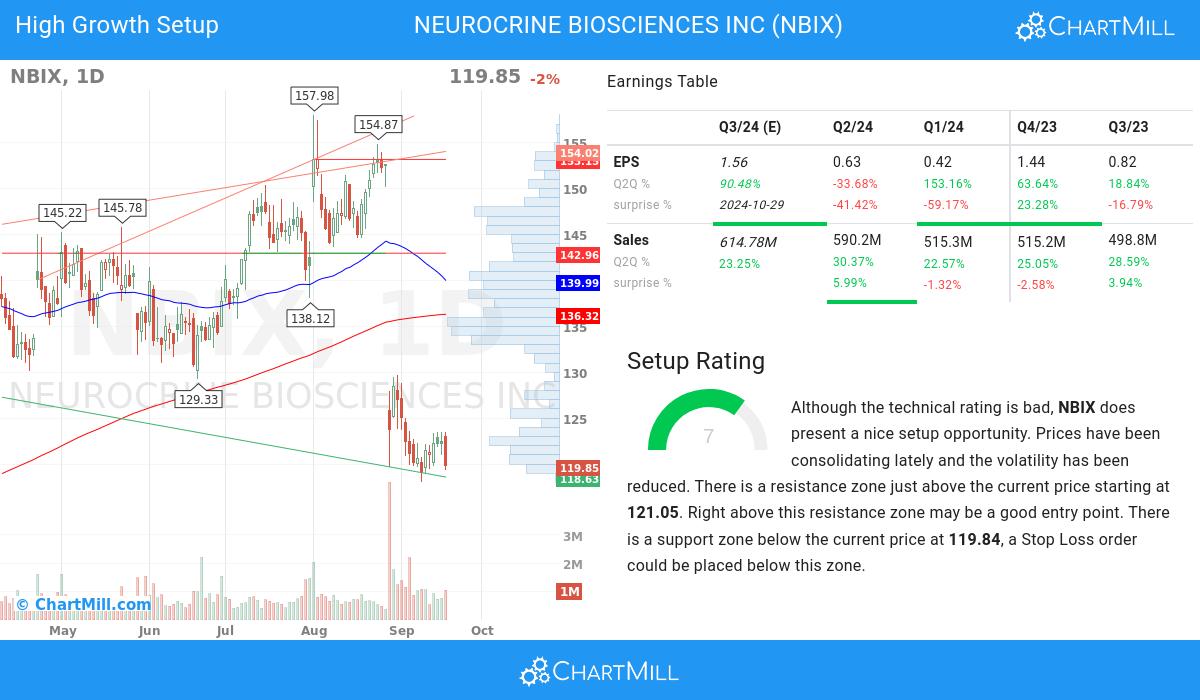
In addition to the Technical Rating, ChartMill provides a Setup Rating for each stock. This rating, ranging from 0 to 10, assesses the level of consolidation in the stock based on multiple short-term technical indicators. Currently, NASDAQ:NBIX has a 7 as its setup rating, indicating its current consolidation status.
Although the technical rating is bad, NBIX does present a nice setup opportunity. We see reduced volatility while prices have been consolidating in the most recent period. There is a resistance zone just above the current price starting at 121.05. Right above this resistance zone may be a good entry point. There is a support zone below the current price at 119.84, a Stop Loss order could be placed below this zone.
Every day, new Strong Growth stocks can be found on ChartMill in our Strong Growth screener.
Check the latest full fundamental report of NBIX for a complete fundamental analysis.
Check the latest full technical report of NBIX for a complete technical analysis.
Disclaimer
This is not investing advice! The article highlights some of the observations at the time of writing, but you should always make your own analysis and invest based on your own insights.