Should you consider MUELLER WATER PRODUCTS INC-A (NYSE:MWA) for high growth investing?
By Mill Chart
Last update: Apr 24, 2025
Our stock screener has detected a potential breakout setup on MUELLER WATER PRODUCTS INC-A (NYSE:MWA). This breakout pattern is observed when a stock consolidates following a strong upward movement. It's important to note that this pattern is based on technical analysis, and the actual breakout outcome is uncertain. However, it might be worth keeping an eye on NYSE:MWA.
Technical analysis of MWA
At ChartMill, a crucial aspect of their analysis is the assignment of a Technical Rating to each stock. This rating, ranging from 0 to 10, is calculated daily by considering numerous technical indicators and properties.
We assign a technical rating of 7 out of 10 to MWA. In the last year, MWA was one of the better performers, but we do observe some doubts in the very recent evolution.
- The long term trend is positive and the short term trend is neutral. The long term trend gets the benefit of the doubt for now.
- When comparing the yearly performance of all stocks, we notice that MWA is one of the better performing stocks in the market, outperforming 95% of all stocks. On top of that, MWA also shows a nice and consistent pattern of rising prices.
- MWA is part of the Machinery industry. There are 128 other stocks in this industry. MWA outperforms 96% of them.
- MWA is currently trading in the upper part of its 52 week range. The market is still in the middle of its 52 week range, so MWA slightly outperforms the market at the moment.
- In the last month MWA has a been trading in the 22.01 - 27.02 range, which is quite wide. It is currently trading near the high of this range.
For an up to date full technical analysis you can check the technical report of MWA
Why is MWA a setup?
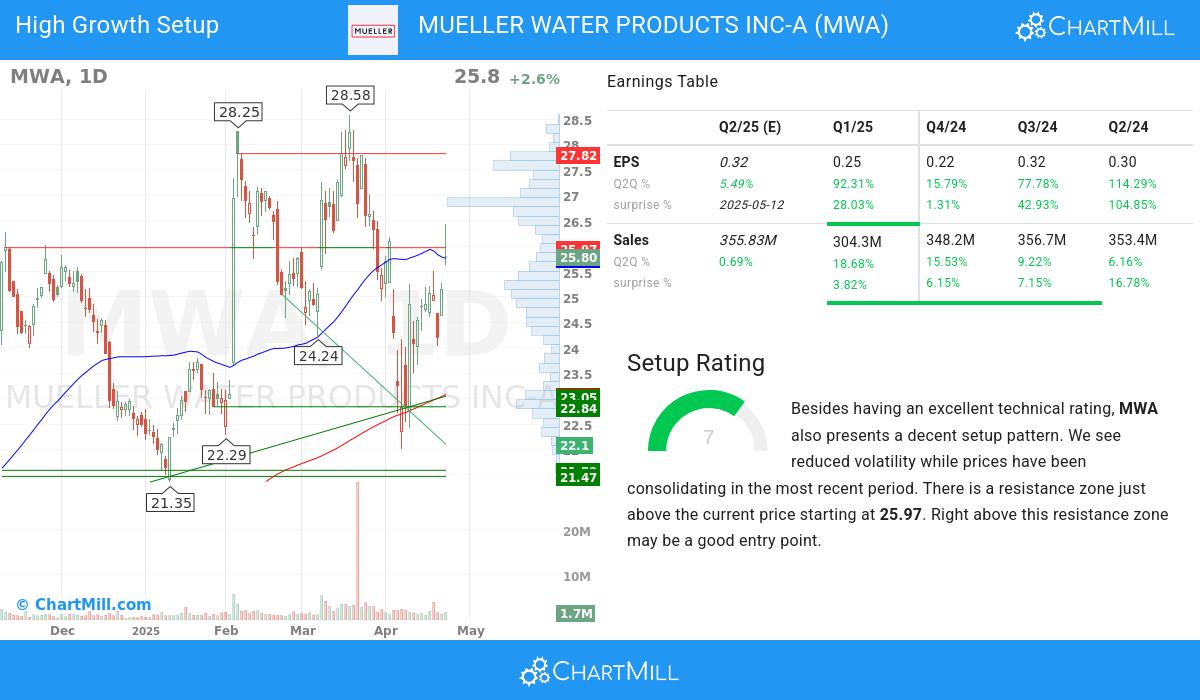
In addition to the Technical Rating, ChartMill provides a Setup Rating for each stock. This rating, ranging from 0 to 10, assesses the extent of consolidation in the stock based on multiple short-term technical indicators. Currently, MWA has a 7 as its setup rating:
MWA has an excellent technical rating and also presents a decent setup pattern. Prices have been consolidating lately and the volatility has been reduced. There is a resistance zone just above the current price starting at 25.97. Right above this resistance zone may be a good entry point.
High Growth Analysis for MWA
ChartMill employs its own High Growth Momentum Rating (HGM) system for all stocks. This score, ranging from 0 to 10, is derived by evaluating different growth and profitability factors, such as EPS and revenue growth, as well as accelleration, surprises and revision history. MWA has earned a 6:
Explosive Earnings Growth
- The quarterly earnings of MWA have shown a 92.31% increase compared to the previous quarter, as revealed in the recent financial report. This growth signifies positive momentum in the company's financials, pointing towards a promising upward trend
- MWA shows accelerating EPS growth: when comparing the current Q2Q growth of 92.31% to the previous quarter Q2Q growth of 15.79%, we see the growth rate improving.
- The 1-year EPS growth of MWA (70.31%) highlights the company's ability to consistently improve its earnings performance and suggests a positive outlook for future profitability.
- MWA has demonstrated strong quarter-to-quarter (Q2Q) revenue growth of 18.68%, reflecting its ability to generate consistent increases in sales. This growth highlights the company's effective market positioning and its potential for continued success.
- The sales growth of MWA is accelerating: the current Q2Q growth of 18.68% is above the previous quarter Q2Q growth of 15.53%. Sales momentum and acceleration are key for high growth systems.
- Sales acceleration happened 3 quarters in a row.
- MWA has consistently surpassed EPS estimates in the last 4 quarters, reflecting its strong financial performance and effective management. This trend suggests the company's ability to generate positive earnings surprises and drive shareholder value.
Profitability & Financial Strength
- The operating margin of MWA has seen steady growth over the past year, signaling improved profitability. This trend indicates the company's effective cost management and its ability to generate higher returns.
- With positive growth in its profit margin over the past year, MWA showcases its ability to improve profitability.
- MWA has shown positive growth in its free cash flow (FCF) over the past year, indicating improved cash generation and financial strength. This growth highlights the company's ability to effectively manage its cash flows and generate surplus funds.
- With a favorable Return on Equity (ROE) of 16.41%, MWA demonstrates its ability to deliver attractive returns for shareholders. This metric highlights the company's effective management of assets and its profitability.
- Maintaining a Debt-to-Equity ratio of 0.54, MWA demonstrates a conservative financial approach. This signifies the company's focus on minimizing debt burdens while preserving a solid equity position.
Strong Market Performance
- MWA has exhibited strong Relative Strength(RS) in recent periods, with a current 95.44 rating. This indicates the stock's ability to outperform the broader market and reflects its competitive position.
Our High Growth Momentum Breakout screen will find you more ideas suited for high growth momentum breakouts.
Keep in mind
Important Note: The content of this article is not intended as trading advice. It is essential to perform your own analysis and exercise caution when making trading decisions. The article presents observations created by automated analysis but does not guarantee any trading or investment outcomes. Always trade responsibly and make independent judgments.
25.8
+0.65 (+2.58%)
Find more stocks in the Stock Screener
MWA Latest News and Analysis
 5 minutes ago - ChartmillShould you consider MUELLER WATER PRODUCTS INC-A (NYSE:MWA) for high growth investing?
Should you consider MUELLER WATER PRODUCTS INC-A (NYSE:MWA) for high growth investing? A fundamental and technical analysis of (NYSE:MWA).
