
Exploring NASDAQ:MU's high growth characteristics.
By Mill Chart
Last update: Oct 16, 2024
We've identified MICRON TECHNOLOGY INC (NASDAQ:MU) as a potential breakout candidate based on our stock screener's analysis. This breakout setup pattern suggests that after a strong uptrend, the stock is currently consolidating, potentially signaling a continuation of the trend. Keep an eye on NASDAQ:MU for further developments.
Deciphering the Technical Picture of NASDAQ:MU
ChartMill assigns a Technical Rating to every stock. This score ranges from 0 to 10 and is updated daily. The score is determined by evaluating multiple technical indicators and properties.
Taking everything into account, MU scores 8 out of 10 in our technical rating. In the past year, MU was one of the better performing stocks in the market. The medium term picture became unclear, although we see some improvement happening in recent action.
- The short term trend is positive, while the long term trend is neutral. So this is evolving in the right direction.
- Looking at the yearly performance, MU did better than 77% of all other stocks. On top of that, MU also shows a nice and consistent pattern of rising prices.
- MU is part of the Semiconductors & Semiconductor Equipment industry. There are 109 other stocks in this industry. MU outperforms 79% of them.
- MU is currently trading in the middle of its 52 week range. The S&P500 Index however is currently trading near new highs, so MU is lagging the market.
- In the last month MU has a been trading in the 86.71 - 114.80 range, which is quite wide. It is currently trading in the middle of this range, so some resistance may be found above.
Our latest full technical report of MU contains the most current technical analsysis.
Why is NASDAQ:MU a setup?
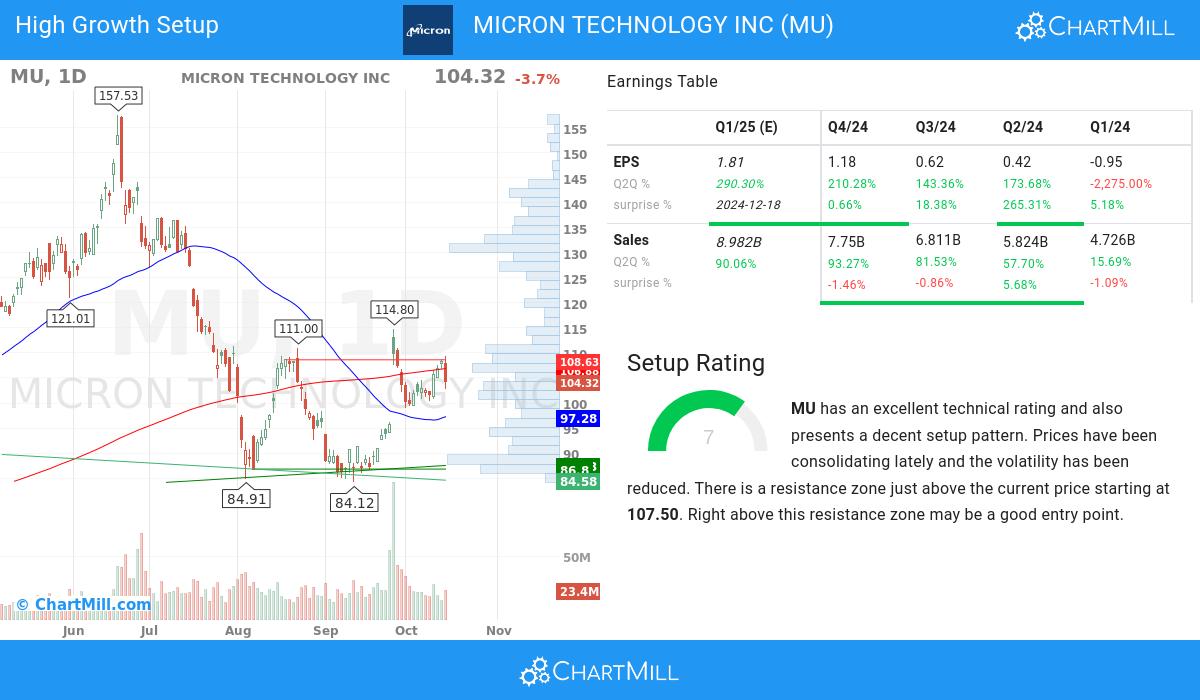
ChartMill takes into account not only the Technical Rating but also assigns a Setup Rating to each stock. This rating, on a scale of 0 to 10, reflects the degree of consolidation observed based on short-term technical indicators. Currently, NASDAQ:MU exhibits a 7 setup rating, indicating its consolidation status in recent days and weeks.
MU has an excellent technical rating and also presents a decent setup pattern. We see reduced volatility while prices have been consolidating in the most recent period. There is a resistance zone just above the current price starting at 107.50. Right above this resistance zone may be a good entry point.
Looking into the high growth metrics of MICRON TECHNOLOGY INC
- With a favorable trend in its quarter-to-quarter (Q2Q) earnings per share (EPS), MICRON TECHNOLOGY INC highlights its ability to generate increasing profitability, showcasing a 210.0% growth.
- MICRON TECHNOLOGY INC has demonstrated strong q2q revenue growth of 93.27%, suggesting a favorable trend in the company's financials and indicating the potential for continued expansion.
- With impressive 1-year revenue growth of 61.59%, MICRON TECHNOLOGY INC showcases its ability to generate increased sales and revenue. This growth highlights the company's strong customer demand and its effective business strategies.
- The quarterly earnings of MICRON TECHNOLOGY INC have shown a 210.0% increase compared to the previous quarter, as revealed in the recent financial report. This growth signifies positive momentum in the company's financials, pointing towards a promising upward trend
- MICRON TECHNOLOGY INC shows accelerating EPS growth: when comparing the current Q2Q growth of 210.0% to the previous year Q2Q growth of -174.0%, we see the growth rate improving.
- MICRON TECHNOLOGY INC has shown positive growth in its operating margin over the past year, indicating improved operational efficiency. This growth highlights the company's ability to effectively manage costs and maximize profitability.
- The free cash flow (FCF) of MICRON TECHNOLOGY INC has seen steady growth over the past year, indicating enhanced cash flow generation and financial health. This trend underscores the company's effective capital management and its ability to generate sustainable cash flows.
- Maintaining a Debt-to-Equity ratio of 0.29, MICRON TECHNOLOGY INC demonstrates a conservative financial approach. This signifies the company's focus on minimizing debt burdens while preserving a solid equity position.
- With 77.92% of the total shares held by institutional investors, MICRON TECHNOLOGY INC showcases a healthy distribution of ownership. This suggests a mix of institutional and retail investors, fostering a dynamic market for the stock.
- MICRON TECHNOLOGY INC has consistently surpassed EPS estimates in the last 4 quarters, reflecting its strong financial performance and effective management. This trend suggests the company's ability to generate positive earnings surprises and drive shareholder value.
- The Relative Strength (RS) of MICRON TECHNOLOGY INC has consistently been strong, with a current 77.82 rating. This indicates the stock's ability to exhibit relative price outperformance and reflects its competitive strength. MICRON TECHNOLOGY INC demonstrates promising potential for sustained price momentum.
Our High Growth Momentum Breakout screen will find you more ideas suited for high growth momentum breakouts.
Disclaimer
This article should in no way be interpreted as advice. The article is based on the observed metrics at the time of writing, but you should always make your own analysis and trade or invest at your own responsibility.
68.8
-0.53 (-0.76%)
Find more stocks in the Stock Screener
MU Latest News and Analysis
 2 days ago - ChartmillMarket Monitor April 17 ( Hertz UP, Nvidia, AMD DOWN)
Wall Street Tumbles as Powell Dashes Rate-Cut Hopes, Nvidia Sinks on Export Restrictions
 3 days ago - ChartmillWednesday's pre-market session: top gainers and losers in the S&P500 index
Before the US market kicks off on Wednesday, let's examine the pre-market session and unveil the notable performers among the S&P500 top gainers and losers.
 4 days ago - ChartmillMarket Monitor April 15 Before Market Open ( Dell, Palantir UP, Meta DOWN)
Wall Street Starts Easter Week Strong as Tariff Concerns Ease
 5 days ago - ChartmillGapping S&P500 stocks in Monday's session
Looking for opportunities in today's market? Check out the S&P500 gap up and gap down stocks on Monday and stay ahead of the market trends.
5 days ago - ChartmillGet insights into the top movers in the S&P500 index of Monday's pre-market session.Let's have a look at what is happening on the US markets before the opening bell on Monday. Below you can find the top S&P500 gainers and losers in today's pre-market session.
 9 days ago - ChartmillWhat's going on in today's session: S&P500 movers
Stay updated with the movements of the S&P500 index in the middle of the day on Thursday. Discover which stocks are leading as top gainers and losers in today's session.
12 days ago - ChartmillWhich S&P500 stocks are moving on Monday?Wondering what's happening in today's session for the S&P500 index? Stay informed with the top movers within the S&P500 index on Monday.
15 days ago - ChartmillDiscover which S&P500 stocks are making waves on Friday.Stay informed about the performance of the S&P500 index one hour before the close of the markets on Friday. Uncover the top gainers and losers in today's session for valuable insights.
15 days ago - ChartmillWhat's going on in today's session: S&P500 moversWondering what's happening in today's session for the S&P500 index? Stay informed with the top movers within the S&P500 index on Friday.
17 days ago - ChartmillWhat's going on in today's session: S&P500 gap up and gap down stocksWondering what's happening in today's session regarding gap up and gap down stocks? Explore the S&P500 index on Wednesday to uncover the stocks that are gapping in the S&P500 index.
19 days ago - ChartmillWhat's going on in today's session: S&P500 moversStay informed about the performance of the S&P500 index one hour before the close of the markets on Monday. Uncover the top gainers and losers in today's session for valuable insights.
19 days ago - ChartmillExploring the top movers within the S&P500 index during today's session.Let's have a look at what is happening on the US markets in the middle of the day on Monday. Below you can find the top S&P500 gainers and losers in today's session.
