
NYSE:MOH stands out as a stock that provides good value for the fundamentals it showcases.
By Mill Chart
Last update: Feb 10, 2025
Consider MOLINA HEALTHCARE INC (NYSE:MOH) as a top value stock, identified by our stock screening tool. NYSE:MOH shines in terms of profitability, solvency, and liquidity, all while remaining very reasonably priced. Let's dive deeper into the analysis.
Valuation Assessment of NYSE:MOH
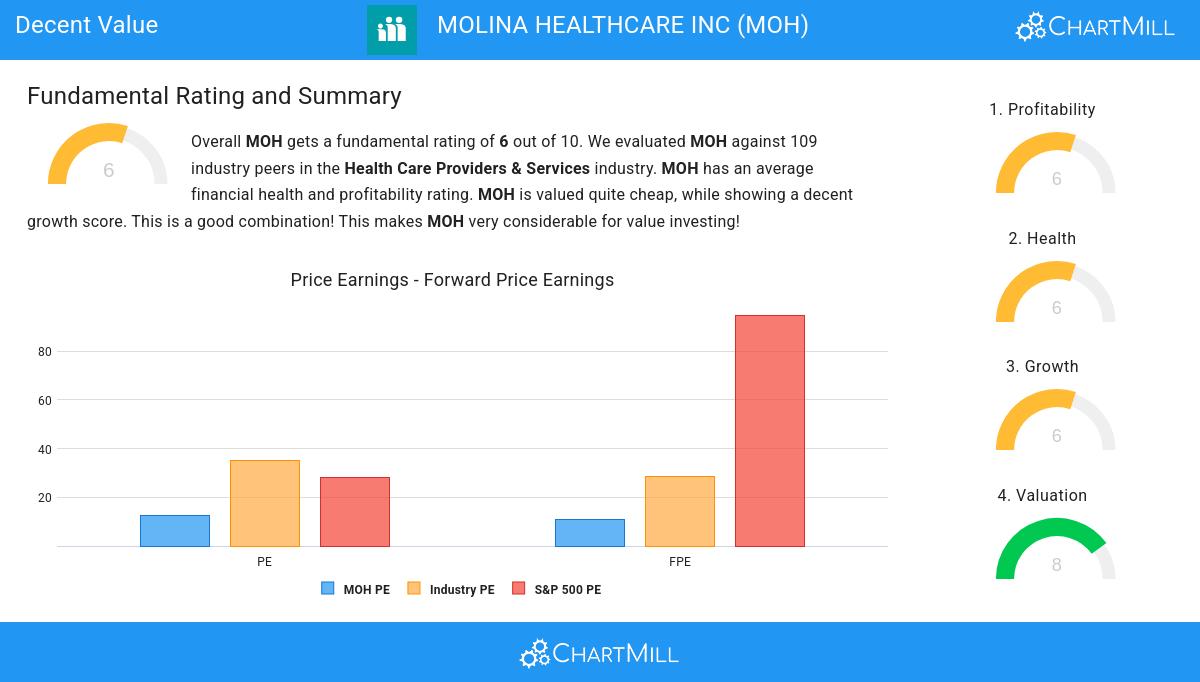
ChartMill provides a Valuation Rating to every stock, ranging from 0 to 10. This rating assesses various valuation aspects, comparing price to earnings and cash flows, while considering factors like profitability and growth. NYSE:MOH boasts a 8 out of 10:
- Compared to the rest of the industry, the Price/Earnings ratio of MOH indicates a rather cheap valuation: MOH is cheaper than 87.04% of the companies listed in the same industry.
- Compared to an average S&P500 Price/Earnings ratio of 28.09, MOH is valued rather cheaply.
- MOH is valuated reasonably with a Price/Forward Earnings ratio of 10.94.
- Based on the Price/Forward Earnings ratio, MOH is valued cheaply inside the industry as 87.04% of the companies are valued more expensively.
- Compared to an average S&P500 Price/Forward Earnings ratio of 94.77, MOH is valued rather cheaply.
- Compared to the rest of the industry, the Enterprise Value to EBITDA ratio of MOH indicates a rather cheap valuation: MOH is cheaper than 99.07% of the companies listed in the same industry.
- MOH's Price/Free Cash Flow ratio is a bit cheaper when compared to the industry. MOH is cheaper than 67.59% of the companies in the same industry.
- The low PEG Ratio(NY), which compensates the Price/Earnings for growth, indicates a rather cheap valuation of the company.
- The decent profitability rating of MOH may justify a higher PE ratio.
- MOH's earnings are expected to grow with 14.88% in the coming years. This may justify a more expensive valuation.
Looking at the Profitability
ChartMill assigns a Profitability Rating to every stock. This score ranges from 0 to 10 and evaluates the different profitability ratios and margins, both absolutely, but also relative to the industry peers. NYSE:MOH scores a 6 out of 10:
- MOH has a better Return On Assets (7.54%) than 91.67% of its industry peers.
- With an excellent Return On Equity value of 26.22%, MOH belongs to the best of the industry, outperforming 94.44% of the companies in the same industry.
- MOH's Return On Invested Capital of 16.44% is amongst the best of the industry. MOH outperforms 94.44% of its industry peers.
- MOH had an Average Return On Invested Capital over the past 3 years of 17.95%. This is significantly above the industry average of 7.97%.
- Looking at the Profit Margin, with a value of 2.90%, MOH is in the better half of the industry, outperforming 72.22% of the companies in the same industry.
- MOH's Operating Margin of 4.21% is fine compared to the rest of the industry. MOH outperforms 60.19% of its industry peers.
Analyzing Health Metrics
ChartMill employs a unique Health Rating system for all stocks. This rating, ranging from 0 to 10, is determined by analyzing various liquidity and solvency ratios. For NYSE:MOH, the assigned 6 for health provides valuable insights:
- MOH has an Altman-Z score of 4.58. This indicates that MOH is financially healthy and has little risk of bankruptcy at the moment.
- MOH's Altman-Z score of 4.58 is amongst the best of the industry. MOH outperforms 83.33% of its industry peers.
- With a decent Debt to FCF ratio value of 5.73, MOH is doing good in the industry, outperforming 75.93% of the companies in the same industry.
- With a decent Current ratio value of 1.62, MOH is doing good in the industry, outperforming 60.19% of the companies in the same industry.
- Looking at the Quick ratio, with a value of 1.62, MOH is in the better half of the industry, outperforming 62.04% of the companies in the same industry.
Growth Assessment of NYSE:MOH
Every stock receives a Growth Rating from ChartMill, ranging from 0 to 10. This rating assesses various growth aspects, including historical and projected EPS and revenue growth. NYSE:MOH boasts a 6 out of 10:
- The Earnings Per Share has grown by an nice 8.43% over the past year.
- MOH shows quite a strong growth in Earnings Per Share. Measured over the last years, the EPS has been growing by 14.16% yearly.
- MOH shows quite a strong growth in Revenue. In the last year, the Revenue has grown by 19.31%.
- The Revenue has been growing by 19.29% on average over the past years. This is quite good.
- Based on estimates for the next years, MOH will show a quite strong growth in Earnings Per Share. The EPS will grow by 14.88% on average per year.
- The Revenue is expected to grow by 9.82% on average over the next years. This is quite good.
Every day, new Decent Value stocks can be found on ChartMill in our Decent Value screener.
Our latest full fundamental report of MOH contains the most current fundamental analsysis.
Disclaimer
This article should in no way be interpreted as advice. The article is based on the observed metrics at the time of writing, but you should always make your own analysis and trade or invest at your own responsibility.
322.19
-10.19 (-3.07%)
Find more stocks in the Stock Screener
MOH Latest News and Analysis
 13 hours ago - ChartmillStay informed with the top movers within the S&P500 index on Thursday.
Stay updated with the movement of S&P500 stocks in today's session. Discover which S&P500 stocks are making waves on Thursday.
 17 hours ago - ChartmillThese S&P500 stocks are gapping in today's session
Stay tuned for the market movements in the S&P500 index on Thursday. Check out the gap up and gap down stocks in the S&P500 index during today's session.
 19 hours ago - ChartmillTop S&P500 movers in Thursday's pre-market session
Let's have a look at what is happening on the US markets before the opening bell on Thursday. Below you can find the top S&P500 gainers and losers in today's pre-market session.
3 days ago - ChartmillUncover the latest developments among S&P500 stocks in today's session.Stay informed about the performance of the S&P500 index one hour before the close of the markets on Tuesday. Uncover the top gainers and losers in today's session for valuable insights.
3 days ago - ChartmillWhich S&P500 stocks are moving on Tuesday?Stay informed about the performance of the S&P500 index in the middle of the day on Tuesday. Uncover the top gainers and losers in today's session for valuable insights.
3 days ago - ChartmillWhat's going on in today's session: S&P500 gap up and gap down stocksLet's take a look at the S&P500 stocks that are experiencing notable price gaps in today's session on Tuesday. Discover the gap up and gap down stocks in the S&P500 index.
4 days ago - ChartmillGapping S&P500 stocks in Monday's sessionLooking for opportunities in today's market? Check out the S&P500 gap up and gap down stocks on Monday and stay ahead of the market trends.
10 days ago - ChartmillTuesday's session: top gainers and losers in the S&P500 indexCurious about the top performers within the S&P500 index one hour before the close of the markets on Tuesday? Dive into the list of today's session's top gainers and losers for a comprehensive overview.
10 days ago - ChartmillWhich S&P500 stocks are gapping on Tuesday?Curious about the market action on Tuesday? Dive into the US markets to explore the gap up and gap down stocks in the S&P500 index during today's session.
15 days ago - ChartmillUncover the latest developments among S&P500 stocks in today's session.Stay updated with the movement of S&P500 stocks in today's session. Discover which S&P500 stocks are making waves on Thursday.
15 days ago - ChartmillThursday's session: top gainers and losers in the S&P500 indexStay informed about the performance of the S&P500 index in the middle of the day on Thursday. Uncover the top gainers and losers in today's session for valuable insights.
