
Why ALTRIA GROUP INC (NYSE:MO) provides a good dividend, while having solid fundamentals.
By Mill Chart
Last update: Mar 29, 2025
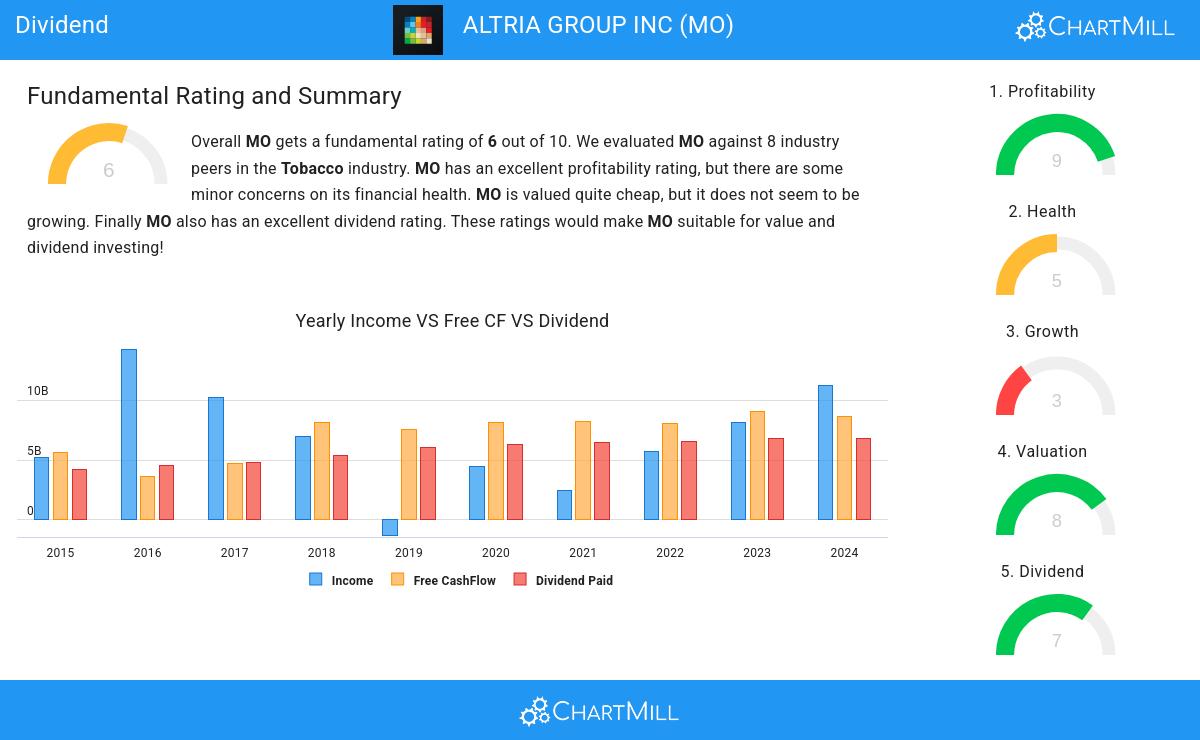
Take a closer look at ALTRIA GROUP INC (NYSE:MO), a stock of interest to dividend investors uncovered by our stock screener. MO excels in fundamentals and provides a decent dividend, all while maintaining a reasonable valuation. Let's break it down further.
Analyzing Dividend Metrics
ChartMill assigns a Dividend Rating to each stock, ranging from 0 to 10. This rating is calculated by analyzing various dividend elements, such as yield, historical performance, dividend growth, and sustainability. MO has been awarded a 7 for its dividend quality:
- MO has a Yearly Dividend Yield of 6.97%, which is a nice return.
- MO's Dividend Yield is rather good when compared to the industry average which is at 4.14. MO pays more dividend than 87.50% of the companies in the same industry.
- Compared to an average S&P500 Dividend Yield of 2.39, MO pays a better dividend.
- MO has been paying a dividend for at least 10 years, so it has a reliable track record.
- MO has not decreased their dividend for at least 10 years, which is a reliable track record.
Analyzing Health Metrics
ChartMill employs a unique Health Rating system for all stocks. This rating, ranging from 0 to 10, is determined by analyzing various liquidity and solvency ratios. For MO, the assigned 5 for health provides valuable insights:
- MO has an Altman-Z score of 4.63. This indicates that MO is financially healthy and has little risk of bankruptcy at the moment.
- Looking at the Altman-Z score, with a value of 4.63, MO belongs to the top of the industry, outperforming 100.00% of the companies in the same industry.
- The Debt to FCF ratio of MO is 2.89, which is a good value as it means it would take MO, 2.89 years of fcf income to pay off all of its debts.
- MO has a better Debt to FCF ratio (2.89) than 87.50% of its industry peers.
Profitability Examination for MO
ChartMill employs its own Profitability Rating system for stock evaluation. This score, ranging from 0 to 10, is derived from an analysis of diverse profitability metrics and margins. In the case of MO, the assigned 9 is noteworthy for profitability:
- MO has a Return On Assets of 31.94%. This is amongst the best in the industry. MO outperforms 100.00% of its industry peers.
- The Return On Invested Capital of MO (34.78%) is better than 100.00% of its industry peers.
- Measured over the past 3 years, the Average Return On Invested Capital for MO is significantly above the industry average of 16.98%.
- The last Return On Invested Capital (34.78%) for MO is above the 3 year average (34.24%), which is a sign of increasing profitability.
- The Profit Margin of MO (46.78%) is better than 100.00% of its industry peers.
- MO's Profit Margin has improved in the last couple of years.
- MO has a Operating Margin of 48.73%. This is amongst the best in the industry. MO outperforms 100.00% of its industry peers.
- MO's Operating Margin has improved in the last couple of years.
- MO's Gross Margin of 59.71% is fine compared to the rest of the industry. MO outperforms 75.00% of its industry peers.
- In the last couple of years the Gross Margin of MO has grown nicely.
Our Best Dividend screener lists more Best Dividend stocks and is updated daily.
Our latest full fundamental report of MO contains the most current fundamental analsysis.
Disclaimer
Important Note: The content of this article is not intended as trading advice. It is essential to perform your own analysis and exercise caution when making trading decisions. The article presents observations created by automated analysis but does not guarantee any trading or investment outcomes. Always trade responsibly and make independent judgments.
58.16
+0.89 (+1.55%)
Find more stocks in the Stock Screener
MO Latest News and Analysis
 18 days ago - ChartmillStay informed with the top movers within the S&P500 index on Wednesday.
Get insights into the S&P500 index performance on Wednesday. Explore the top gainers and losers within the S&P500 index in today's session.
18 days ago - ChartmillWednesday's session: top gainers and losers in the S&P500 indexStay updated with the movements of the S&P500 index in the middle of the day on Wednesday. Discover which stocks are leading as top gainers and losers in today's session.
 18 days ago - ChartmillWhat's going on in today's session: S&P500 gap up and gap down stocks
Wondering what's happening in today's session regarding gap up and gap down stocks? Explore the S&P500 index on Wednesday to uncover the stocks that are gapping in the S&P500 index.
20 days ago - ChartmillExploring the top movers within the S&P500 index during today's session.Let's have a look at what is happening on the US markets in the middle of the day on Monday. Below you can find the top S&P500 gainers and losers in today's session.
