
Analyzing NYSE:MO's Dividend Potential.
By Mill Chart
Last update: Oct 25, 2024
ALTRIA GROUP INC (NYSE:MO) is a hidden gem unveiled by our stock screening tool, featuring a promising dividend outlook alongside solid fundamentals. NYSE:MO demonstrates decent financial health and profitability while ensuring a sustainable dividend. Let's break it down further.
Dividend Examination for NYSE:MO
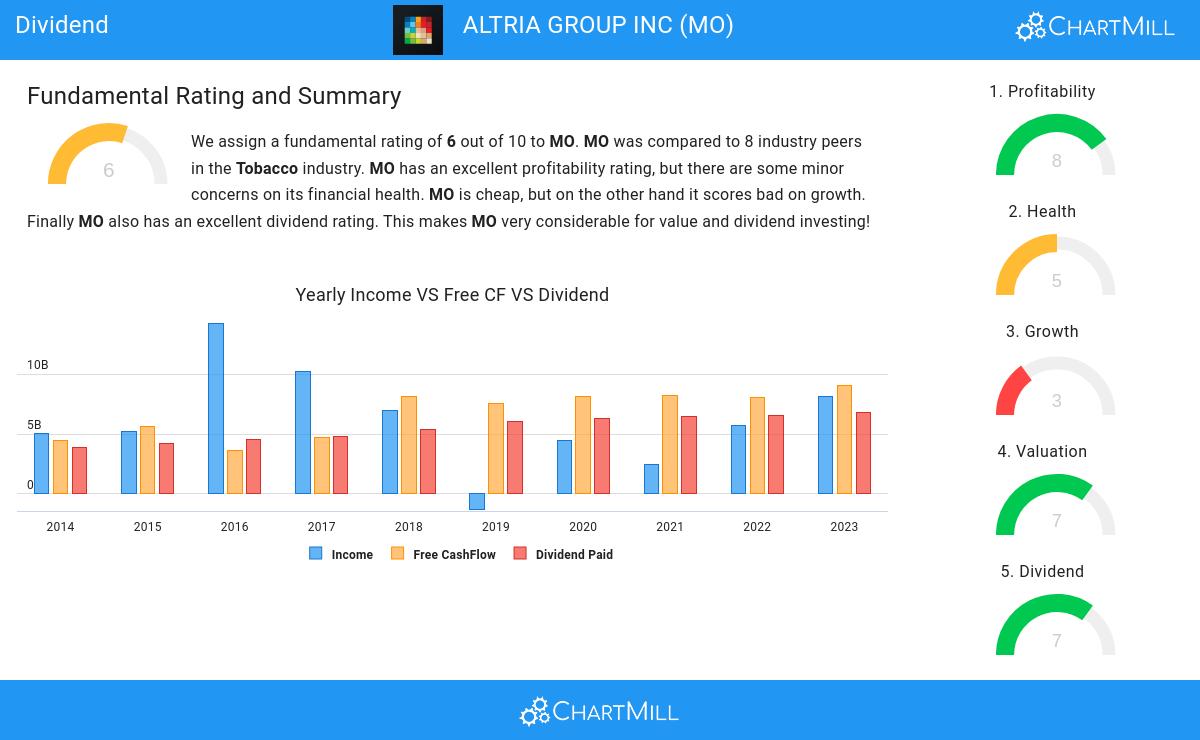
ChartMill assigns a Dividend Rating to every stock. This score ranges from 0 to 10 and evaluates the different dividend aspects, including the yield, the growth and sustainability. NYSE:MO scores a 7 out of 10:
- MO has a Yearly Dividend Yield of 8.20%, which is a nice return.
- Compared to an average industry Dividend Yield of 4.73, MO pays a better dividend. On top of this MO pays more dividend than 87.50% of the companies listed in the same industry.
- Compared to an average S&P500 Dividend Yield of 2.19, MO pays a better dividend.
- MO has been paying a dividend for at least 10 years, so it has a reliable track record.
- MO has not decreased their dividend for at least 10 years, which is a reliable track record.
Deciphering NYSE:MO's Health Rating
Every stock is evaluated by ChartMill, receiving a Health Rating on a scale of 0 to 10. This assessment considers different health aspects, including liquidity and solvency, both in absolute terms and relative to industry peers. NYSE:MO has achieved a 5 out of 10:
- MO has an Altman-Z score of 4.39. This indicates that MO is financially healthy and has little risk of bankruptcy at the moment.
- MO's Altman-Z score of 4.39 is amongst the best of the industry. MO outperforms 87.50% of its industry peers.
- MO has a debt to FCF ratio of 2.84. This is a good value and a sign of high solvency as MO would need 2.84 years to pay back of all of its debts.
- Looking at the Debt to FCF ratio, with a value of 2.84, MO belongs to the top of the industry, outperforming 100.00% of the companies in the same industry.
Profitability Examination for NYSE:MO
ChartMill's Profitability Rating offers a unique perspective on stock analysis, providing scores from 0 to 10. These ratings consider a wide range of profitability metrics and margins, both in comparison to industry peers and on their own merits. For NYSE:MO, the assigned 8 is a significant indicator of profitability:
- The Return On Assets of MO (29.47%) is better than 100.00% of its industry peers.
- MO's Return On Invested Capital of 33.01% is amongst the best of the industry. MO outperforms 87.50% of its industry peers.
- The last Return On Invested Capital (33.01%) for MO is above the 3 year average (31.67%), which is a sign of increasing profitability.
- MO has a better Profit Margin (42.15%) than 100.00% of its industry peers.
- MO's Profit Margin has improved in the last couple of years.
- MO has a Operating Margin of 47.93%. This is amongst the best in the industry. MO outperforms 87.50% of its industry peers.
- MO's Operating Margin has improved in the last couple of years.
- MO's Gross Margin of 58.64% is fine compared to the rest of the industry. MO outperforms 75.00% of its industry peers.
- In the last couple of years the Gross Margin of MO has grown nicely.
Our Best Dividend screener lists more Best Dividend stocks and is updated daily.
Our latest full fundamental report of MO contains the most current fundamental analsysis.
Keep in mind
This is not investing advice! The article highlights some of the observations at the time of writing, but you should always make your own analysis and invest based on your own insights.
58.07
-0.32 (-0.55%)
Find more stocks in the Stock Screener
MO Latest News and Analysis
